
Lecture
The term «big data» came into wide use not long ago, denoting a new applied field — the search for methods of automatically and quickly analyzing huge volumes of heterogeneous information. The science of big data is still taking shape, but it is already in great demand — and demand for it will only grow in the future.
With its help it is possible to solve incredible problems: assessing the state of the liver from a cardiogram, predicting a salary from a job description, recommending music to a user based on their profile on the internet. Big data can be anything: the results of scientific experiments, logs of bank transactions, meteorological observations, social network profiles — in short, anything that may be useful to analyze. The most promising approach to big data analysis is considered to be the application of machine learning — a set of methods thanks to which a computer can find previously unknown relationships and patterns in data.
Brief course syllabus:
1. Introduction. Example problems. Logical methods: decision trees and decision forests.
2. Metric classification methods. Linear methods, stochastic gradient.
3. Support vector machine (SVM). Logistic regression. Classification quality metrics.
4. Linear regression. Dimensionality reduction, principal component analysis.
5. Algorithm compositions, gradient boosting. Neural networks.
6. Clustering and visualization. Semi-supervised learning.
7. Applied data analysis problems: formulations and solution methods.
The participant needs to know the basic concepts of mathematics: functions, derivatives, vectors, matrices. Basic programming skills will be required to complete the practical assignments. Knowledge of Python is highly desirable
§1 First qualifying round
1.1. Mathematics problems
1.2. Computer science problems
§2 Second qualifying round
2.1. Data analysis problems
§3 Final round: individual part
3.1. Mathematics problems
3.2. Computer science problems
§4 Final round: team part
4.1. Description of the source data
4.1.1. User graph
4.1.2. User demographics
4.2 Problem statements
Problem 4.2.1 «Date of Birth»
Problem 4.2.2 «Region»
Problem 4.2.3 «Finding Connections»
Problem 1.1.1 (1 point)
In search of extraterrestrial life, scientists discovered an interesting living organism -
the Kamkohob. Experiments under terrestrial conditions showed that the Kamkohob reproduces
by division. That is, the parent organism disappears and new individuals are formed. At the same time,
each individual either divides into exactly 5 offspring, or does not reproduce and remains a single
individual . The experimental specimen brought to Earth reproduced, and some of its
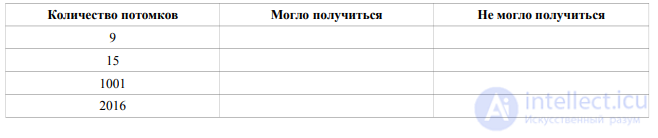
offspring also reproduced. Select in the table which numbers of offspring could
result in the end, and which could not.
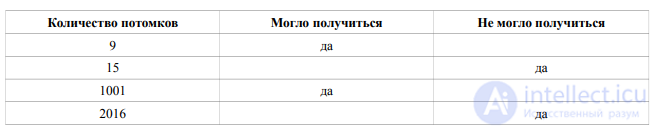
SOLUTION:
The correct answer to the problem is shown in the table. The solution process is
discussed in more detail in the next problem.
Problem 1.1.2 (1 point)
In search of extraterrestrial life, scientists discovered an interesting living organism -
the Kamkohob. Experiments under terrestrial conditions showed that the Kamkohob reproduces
by division. That is, the parent organism disappears and new individuals are formed. At the same time,
each individual either divides into exactly 5 offspring, or does not reproduce and remains a single
individual. The experimental specimen brought to Earth reproduced, and some of its
offspring also reproduced. What number of offspring could result? Describe the entire
series of possible answers with a general formula, using the variable x (where x is a natural
number).
SOLUTION:
Let us look at how the total number of individuals changes with one reproduction event.
The parent individual disappears, and 5 new ones appear. That is, the total number increases
by 4. Since we initially have one individual, the only possible resulting number is one giving
a remainder of 1 when divided by 4.
The formula 4x+1, where x is a natural number, describes all possible options.
Indeed, to obtain 4x+1 individuals, it is enough to have any x individuals reproduce.
Problem 1.1.3 (1 point)
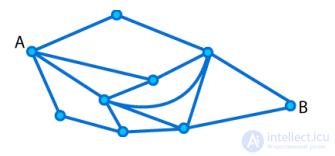
A bus travels from point A to point B. At any given moment it moves
to the right, so as to get closer to point B, sometimes up and to the right, sometimes down and to the right. Find
the number of ways to get there. The picture shows a diagram of the roads between the cities.
SOLUTION:
Let us assign the number of ways to reach each vertex, moving from left to right.
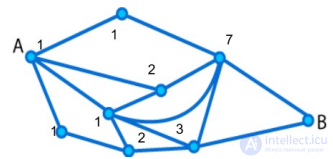
There are 7+3=10 ways to reach vertex B. Answer: 10
Problem 1.1.4 (1 point)
A bus travels from point A to point B. At any given moment it moves
to the right, so as to get closer to point B, sometimes up and to the right, sometimes down and to the right. Find
the number of ways to get there. The picture shows a diagram of the roads between the cities.
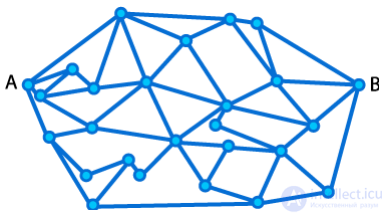
SOLUTION:
Let us assign the number of ways to reach each vertex, moving from left to right.
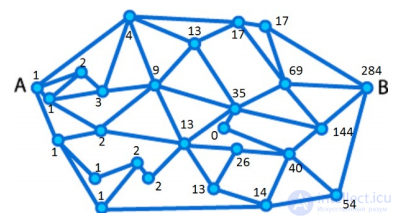
Answer: 284
Problem 1.1.5 (1 point)
The hapless cosmonaut Innokentiy felt unwell after the centrifuge and
cannot determine the direction; he is 5 meters from the commission and moves along a
straight line. Every second, with equal probability, he either moves one meter closer to it or
moves farther away. If he reaches the commission, he does not go anywhere else. Find the probability
of reaching the commission no later than at the 6th second.
Solution:
Let the commission be located five meters to the right of the cosmonaut.
Any path of the cosmonaut over 6 seconds is encoded by a sequence of 6 symbols
R or L (R if he moves right, and L if left). There are 64 such sequences in total, of
which two suit us: RRRRRR and RRRRRL.
So the probability of reaching the commission is 2/64=1/32
Answer: 1/32
Problem 1.1.6 (1 point)
The hapless cosmonaut Innokentiy felt unwell after the centrifuge and
cannot determine the direction; he is 5 meters from the commission and moves along a
straight line. Every second, with equal probability, he either moves one meter closer to it or
moves farther away. If he reaches the commission, he does not go anywhere else. Find the probability
of reaching the commission no later than at the 10th second.
SOLUTION:
Let us plot the cosmonaut's path on a graph. Let time be on the vertical axis and
distance on the horizontal axis. Initially the cosmonaut is at point s=0, and the commission is at point
s=5.
The figure shows the path for the sequence RRLRRRR:
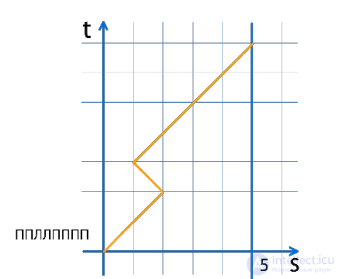
Note also that the cosmonaut can reach the commission only at odd steps.
Thus, we are interested in how many paths there are leading to the commission in 5, 7, and 9
seconds.
Let us reformulate the problem: how many paths are there on the grid in the figure below,
leading to the line s=5. One can only move upward.
Let us count the number of such paths for each point, starting from the initial one.
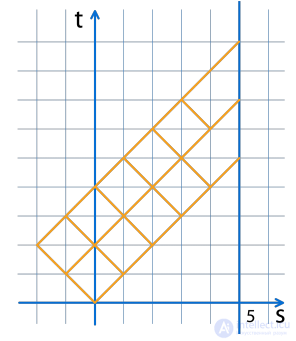
In 5 steps there is 1 path, in 7 steps — 5 paths, in 9 steps — 20 paths.
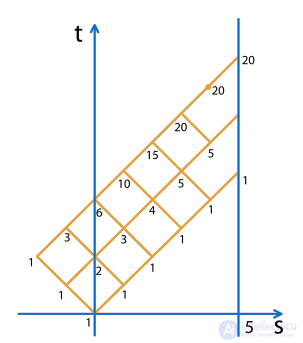
So the required probability equals 1/32+5/128+20/512 = 7/64
Answer: 7/64
Problem 1.1.7 (1 point)
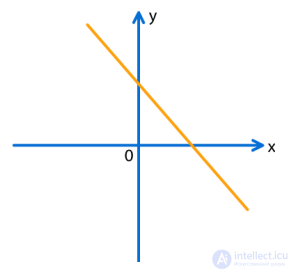
On the coordinate plane, the graph of the function y=kx+b is given.
Find the maximum value of the function y=kx2+bx.
SOLUTION:
Since y = kx+b is decreasing, k<0 y = kx2+bx = x(kx+b) is a parabola with «branches down», with zeros x = 0 and x = -b/k. The abscissa of the parabola's axis is x= -b/2k; substituting we find the maximum y=-b2/4k
Problem 1.1.8 (1 point)
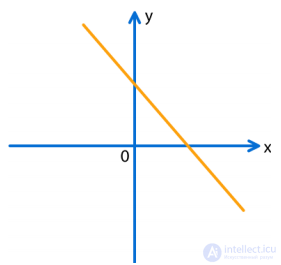
On the coordinate plane, the graph of the function y=kx+b is given. Consider the points of intersection of this function's graph with the graph of the function y=kx2+bx. Among these points, choose the one with the smallest abscissa and give this abscissa as the answer.
SOLUTION:
The graph of the quadratic function y = x(kx + b) is a parabola with «horns down»,
since k<0
One of the zeros of this function coincides with the zero of the function y = kx + b, and the other is: x = 0.
Between the zeros lies the second point of intersection of the graphs. One of the roots of the equation
x(kx + b) = kx + b is x = 1, which gives the abscissa of the second intersection point of the given and
required graphs.
Answer: 1
Problem 1.2.1 «Dice» (1 point)
In some cells of a 4×4 square board there are four-sided dice
A die is removed from the board if the number of non-empty neighboring cells (by side)
coincides with the number rolled on the die. All dice for which this property holds are
removed from the board simultaneously. If, after removing the dice, new dice appear that
can be removed, then they are removed by the same rules.
You need to move one die so that the maximum number of dice is removed.
Input data format:
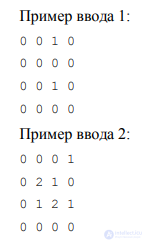
The input to the program is four lines with four numbers each, separated by
a single space. All numbers are non-negative integers not exceeding 4. Zero means
the absence of a die, any positive number means the presence of a die showing the given
number.
It is guaranteed that there is at least one die and one free
cell on the board
Output data format:
As the answer, you need to output a single integer — the number of dice that can be
removed from the board.
Example output 1:
2
Example output 2:
6
Explanation. In the second example, you can move the one from the first row to the
fourth row, under the two. Then the upper-left two will have two neighbors and will be removed. Likewise
the one in the fourth row and the one in the fourth column will be removed with it, since they each have
one neighbor. After that, two ones and one two will remain on the board — their common
neighbor. All remaining dice can be removed, since the removal rule holds.
METHOD OF EVALUATING THE SOLUTION:
To generate a unique statement and check the result, the following
Python code is used. The generate function returns a set of tests and the correct answers:
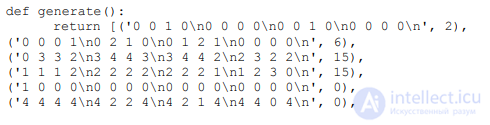
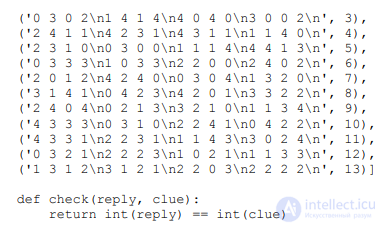
SOLUTION:
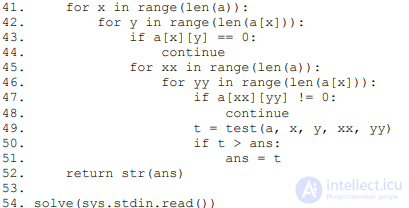
In this problem you need to carefully implement what is specified in the statement. An example
of a program implementing this algorithm in Python:


Problem 1.2.2 «Roots» (3 points)
The boy Petya has a number N. But he does not need it, unlike the number X. To
obtain it, Petya can take an integer root, multiply, and add numbers.
The integer root of degree k of a natural number n is defined as the largest
a natural number for which the relation holds:  . For example, the integer fifth root of a thousand is three, since
 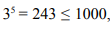 , and 4^5 =1024 > 1000. Let us denote this as
  . We will also assume that the degree of the root can only be a natural number.
For Petya, taking an integer root — is a difficult task, and he wants to minimize the total degree of the roots that appear in the formula for obtaining X.
And Petya also has an older brother. Whose name is Dima. This Dima decided to add
interest to Petya's problem, and impose the following restrictions:
1. Petya may not take roots of numbers other than N.
2. Only those numbers that Petya obtained by taking a root
or by multiplying other numbers may be multiplied.
3. Numbers obtained as a result of multiplication, taking a root,
or the sum of other numbers may be added.
Help Petya write an expression that will be easy to compute and fits the
restrictions imposed by Dima. Find the minimum complexity of the required expression.
Input data format:
The single line contains two integers N and X (1 ≤ X, N ≤ 1000).
Example input:
100 126
Output data format:
Output a single natural number — the answer to the problem.
Example output:
Explanation of the example: 
METHOD OF EVALUATING THE SOLUTION:
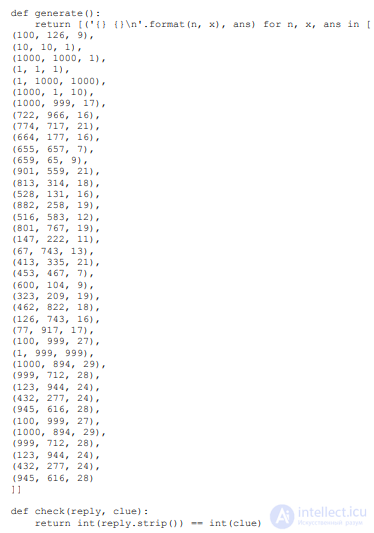
To generate a unique statement and check the result, the following
Python code is used. The generate function returns a set of tests and the correct answers:
SOLUTION:
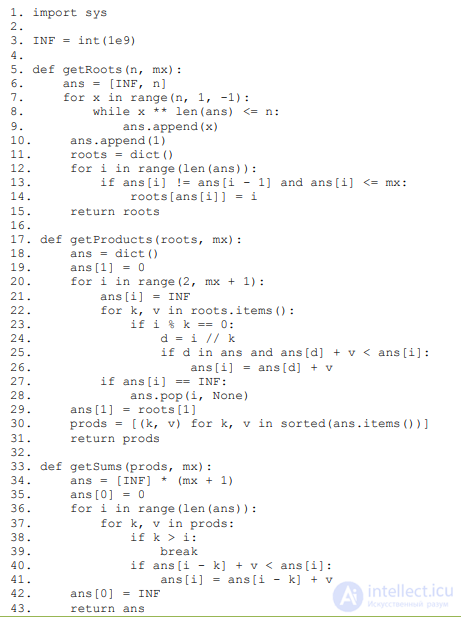
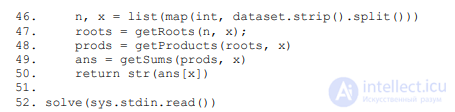
The solution consists of three stages. In the first stage, one needs to compile a set of powers and
roots of N that may be advantageous to use. If two roots of different degree are
equal, then it is advantageous for us to use the one of them whose degree is smaller. Since 2^10 >
1000, for any N there will be no more than 11 distinct roots. In the second stage, using
dynamic programming, we obtain a list of numbers that can be obtained
by multiplying roots with the optimal total degree. In the third stage, using the
same method, we obtain a list of numbers that can be obtained by addition
numbers from the previous stage with optimal sums.
An example program implementing this algorithm in Python:

Problem 1.2.3 «Line and Points» (3 points)
A line passing through the origin is drawn on the plane. Also on the
plane, N points are chosen, and for each it is known which side of the line it lies on.
And M points, for which the same question needs to be answered.
Input data format:
The first line contains a natural number N — the number of points for which it is known which
side of the line they lie on (1≤N≤100000). The following N lines describe these
points. Each line consists of three integers separated by spaces — the coordinates of the
point and an indication of which side the point lies on. All points for which the third number equals
zero lie on one side of the line, and those with one — on the other. There are no other values of the third
parameter.
The next line contains the number M — the number of points for which the
side needs to be indicated (1≤M≤100000). The following M lines contain pairs of integers — the coordinates of the points.
The coordinates of all points do not exceed 1000000 in absolute value.
It is guaranteed that none of the points lies on the line.
Example input:
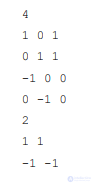
Output data format:
For each of the M points, output 0 or 1 — the side on which the point lies, in the same
sense as in the input data. It is guaranteed that the answer is unique.
Example output:
1
0
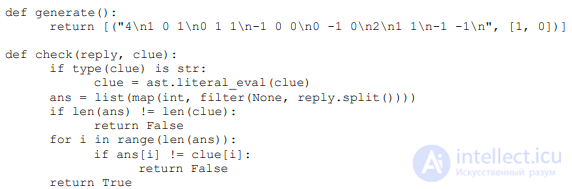
METHOD OF EVALUATING THE SOLUTION:
To generate a unique statement and check the result, the following
Python code is used. The generate function returns a set of tests and the correct answers:
SOLUTION:
If we reflect all the points for which
the «side» equals
1, relative to the origin
of coordinates, then all the points fall into a certain sector of the plane. It remains to find the line
that does not intersect this sector. It can be found as follows: find the two rays
that form the boundaries of the sector (for example, using the pseudo-scalar product).
The required line will be perpendicular to the bisector of these rays.
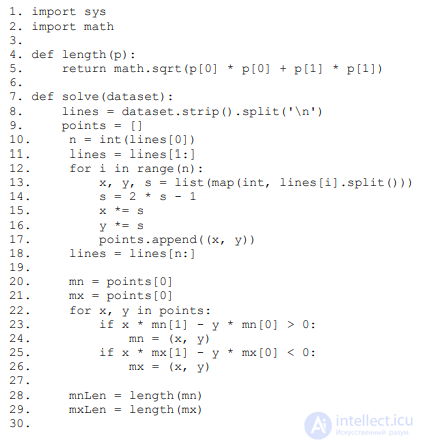
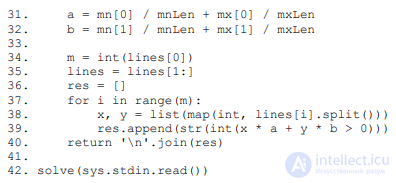
An example program implementing this algorithm in Python:
Problem 1.2.4 «Black Box» (5 points)
There is a black box with two real-valued inputs and one binary output.
Given a set of input and output data, you need to predict as accurately as possible
the black box's answers on data from another sample of input data.
Input data format:
The first line contains the number N — the number of input data points for which the
answers are known. The following N lines each contain two real numbers and one natural number,
separated by spaces — the input parameters and the black box's answer, respectively.
The next line contains the number M — the number of input data points for which
the answer needs to be found. The following M lines each contain two real numbers, separated
by a space — the input data itself.
Output data format:
As the answer, you need to return M numbers — the predicted answers of the black box.
Note 1: In this problem you need to download the test file, solve the problem on
your computer, and return the answer within five minutes. During the solution process you may
use any materials, languages, and programs. Five minutes after the start of
solving the problem, the test is marked as outdated and its answer is no longer accepted. After that,
you can request a new test, and the timer restarts. The number of attempts is
unlimited. It is guaranteed that all tests were obtained using a single black box
with a minor change of internal constants.
Note 2: This problem allows for a partial solution. In
case correct answers are given for fewer than half of the inputs, the problem
is awarded 0 points. If the percentage of correct answers exceeds 95%, 5
points are awarded. Otherwise 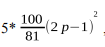 is awarded, where p — is the fraction of correct answers.
METHOD OF EVALUATING THE SOLUTION:
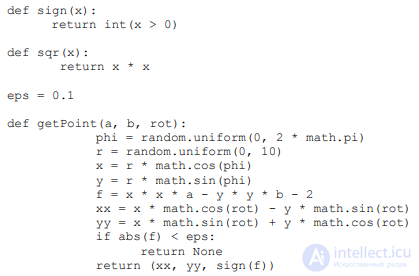
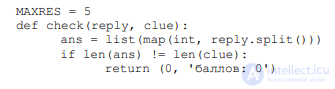
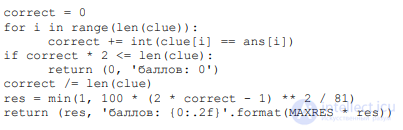
To generate a unique statement and check the result, the following
Python code is used. The generate function returns a set of tests and the correct answers:

SOLUTION:
If we plot this test on a plane, treating the pairs of numbers as coordinates, then
we can notice that there is one zone into which all points with one answer fall, and two,
into which the rest fall. Moreover, the boundaries of these regions have a simple structure. Further,
one could either recognize that the boundary is a hyperbola and reconstruct its
parameters, or use special tools, or implement
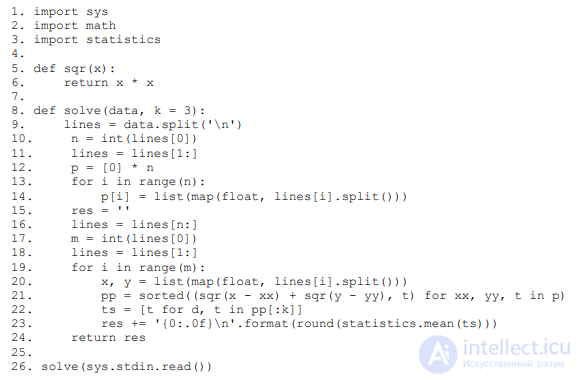
a suitable machine learning algorithm, for example, the «three-nearest-neighbors method»: for the
point under study we select the three nearest ones. The answer for the point will match the prevailing answer
among the neighbors.
An example program implementing this algorithm in Python:
The number of points earned in solving all problems is summed. Prize-winners of
the first qualifying round need to score 7 points (for 9th grade) and 9 points (for grades 10-11
). Winners of the first qualifying round must score 20 points.
The second qualifying round is held in team format over the internet; submissions
are evaluated automatically by the online testing system. The duration
of the second qualifying round is 2 weeks. The problems are interdisciplinary in nature
and, in a simpler form, recreate the engineering problem of the final round. Solving
the problems involved writing programs; it was allowed to use the programming language
Python. Solving each problem gives a certain number of points. In this round it is possible
to obtain a total of 0 to 45 points.
Problem 2.1.1 (10 points)
1000 schoolchildren arrived at a summer camp. When a schoolchild arrived, they were immediately
registered (assigned a sequential number starting from zero — the order in which the schoolchild arrived at
the camp). The schoolchildren were immediately divided into groups with different numbers of people per group:
the first n1 schoolchildren were assigned to the first group, the next n2 schoolchildren — to the second
group, the next n3 schoolchildren — to the third, and so on.
One day all the even-numbered groups were taken on an excursion. And a commission arrived at the camp and
recorded all the schoolchildren who remained (each schoolchild stated the number they had been assigned
when they arrived at the camp). By mistake, some schoolchildren were recorded
several times. How can one now determine which schoolchild is in which group?
The input is an array of numbers corresponding to the sequential numbers
of the recorded schoolchildren who remained at the camp.
The output is a set of pairs of numbers: the sequential number of the first and last
schoolchild in the first group, the sequential number of the first and last schoolchild in the second
group, and so on.
For a successful solution to the problem, participants receive 10 points.
Example input:
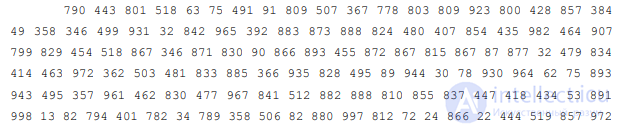

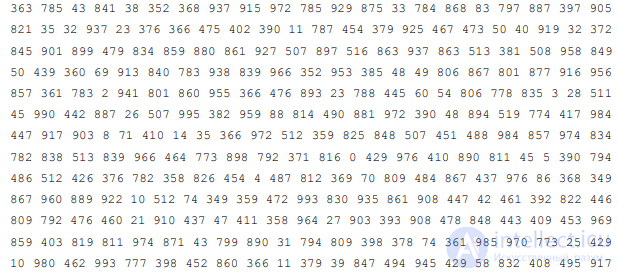

Example output:

Program execution time limit: 15 s
RAM usage limit: 256 MB
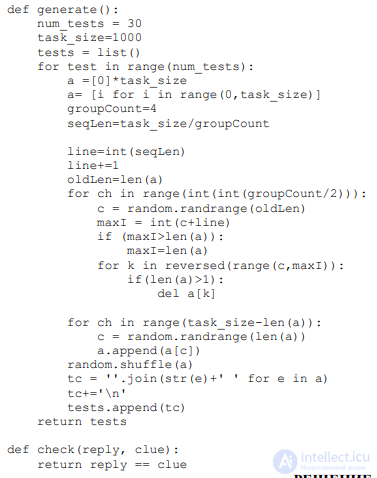
METHOD OF EVALUATING THE SOLUTION:
To generate a unique statement and check the result, the following
Python code is used. The generate function returns a set of tests and correct
answers:
SOLUTION:
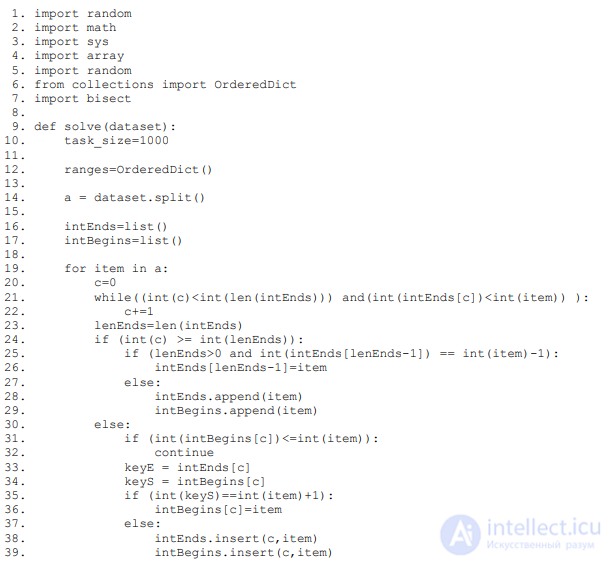
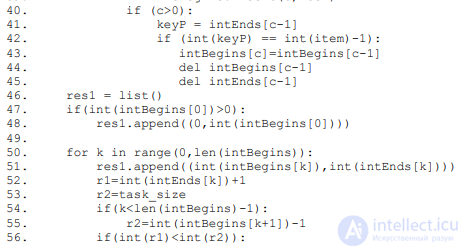
It is necessary to understand that since the numbers are consecutive, after sorting all the given numbers, the filled consecutive intervals of numbers will be the odd-numbered groups, and the missing intervals will be the even-numbered ones. There are then several approaches to
the solution, but all of them are in one way or another related to sorting the array. One of the approaches
involves using merge sort, adding new elements to an already
sorted array of schoolchildren's numbers, filling in the intervals as it goes. The second
consists of filling the array and then sorting it using standard built-in
algorithms, and on a second pass through the array, identifying the filled intervals.
Program code in Python:

Problem 2.1.2 (15 points)
A cartographer compiled, for each city, a list of the cities to which it is connected
roads. Now he is asked whether it is possible to travel between two distant
cities.
The input consists of two city names that need to be checked, and then follows
a listing, for each city, of which other cities it is connected to by a road. The answer must be
given in the format True and False.
For a successful solution to the problem, participants receive 15 points.
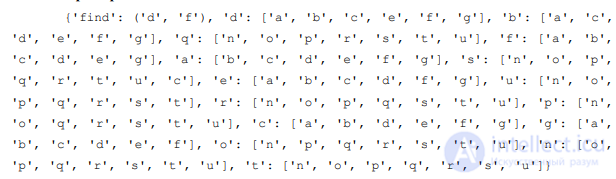
Example input:
Program execution time limit: 3000 s
RAM usage limit: 256 MB
METHOD OF EVALUATING THE SOLUTION:
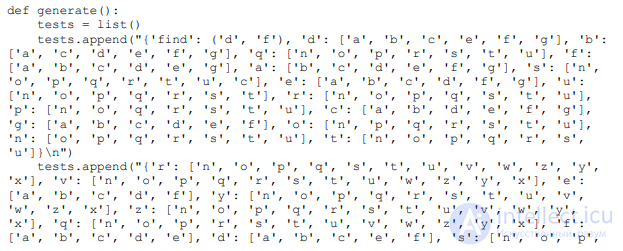
To generate a unique statement and check the result, the following
Python code is used. The generate function returns a set of tests and the correct answers.
An example of several tests with correct answers is shown below:

SOLUTION:
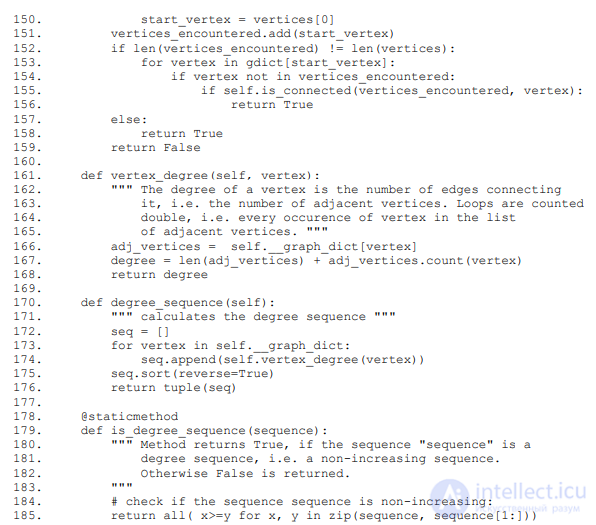
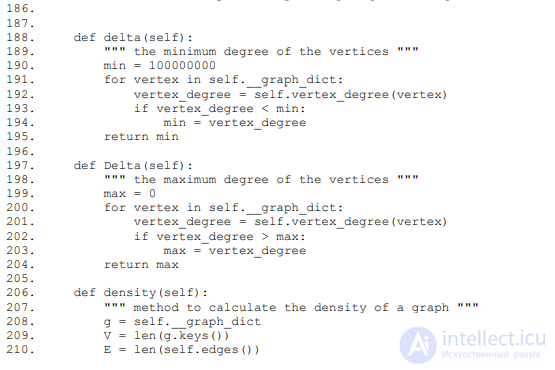
It is necessary to recognize in the problem the task of finding a path between two vertices in a
graph. Schoolchildren need to choose a way to represent the graph in memory and
perform a breadth-first search from one vertex to the other. If the algorithm
finishes without encountering the second vertex, then there is no path, otherwise — there is one.
Solution code in Python:







Problem 2.1.3 (0-20 points)
The problem features a social network graph we invented
(for each
user it is indicated which users added them as a friend). For each user,
their popularity is calculated, based on how many people are friends with those
users that they are friends with.
Popularity is calculated as X — the total number of people who are friends with their friends, counting themselves.
You need to calculate two percentiles, 50 and 90, i.e., the two smallest popularity values such that, with probability 50% for the first and 90% for the second, the popularity
of a random user will be less than the given value.
The problem must be solved on your own computer, and the solution must be uploaded to the system in the
the form of two numbers for each problem.
If for all tests you calculated at least the 50th percentile (with 50 percent
probability the popularity will be lower), then you get half the points for the problem.
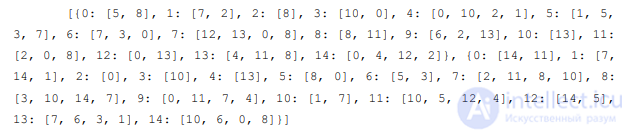
Example input:
Example output:
[(4, 6), (7, 9)]
RAM usage limit: 256 MB
Time per attempt: 5 min
METHOD AND CRITERION FOR EVALUATING THE SOLUTION:
To generate a unique statement and check the result, the following
Python code is used. The generate function returns a set of tests and the correct answers:
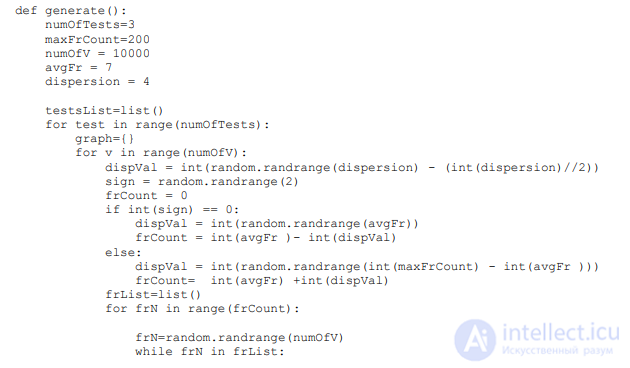
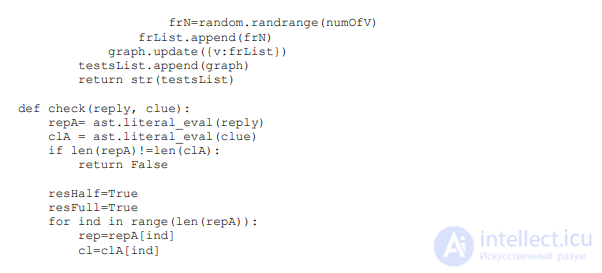
The check function returns an accuracy score for the solution (from 0 to 1). This
value is multiplied by 20, which gives the number of points earned by the team.
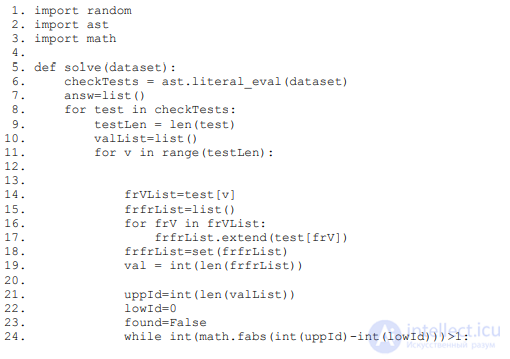
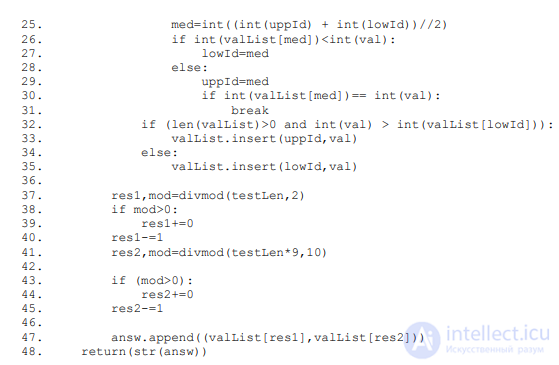
SOLUTION:
For this problem, one first needs to decide on the internal
representation of the social network graph data. After that, for all users
calculate the popularity value. Then the users need to be sorted by
popularity (based on the knowledge from the first problem), and take the corresponding element
of the array (the middle one for the 50th percentile, and the one at position 0.9*N, where N is the number of elements
of the array, for the 90th percentile).
Program code in Python:
The number of points earned in solving all problems is summed. Prize-winners of
the second qualifying round needed to score 10 points (for 9th-grade students) and 15
points (for 10th-11th-grade students). Winners of the second qualifying round had to
score 45 points.
The final round of the olympiad consists of two parts: individual solving of
problems by subject (mathematics, computer science) and team solving of an engineering problem. For
individual problem solving, 2 hours are given per subject. The mathematics and
computer science problems are common to the 9th and 10th-11th grade tracks. Solving each problem gives a certain
number of points (see the evaluation criteria below). In mathematics, for each problem you can
receive from 0 to the specified number of points according to the criteria described.
Points for computer science are awarded in full for a correct solution to the problem.
Solving the computer science problems involved writing solutions in the Python language. Participants
receive a score for solving problems combined across all subjects of this profile
(mathematics and computer science) — a total of 0 to 24 points.
Problem 3.1.1 (max. 6 points)
A group of psychologists developed a test; after taking it, each person receives
a score - the number Q - an indicator of his mental abilities (the higher Q, the greater the
abilities). The country's rating is taken to be the arithmetic mean of the Q values of all
residents of that country.
Task 3.1.1a (1 point). A group of citizens of country A emigrated to country B.
Show that in doing so, the rating of both countries could have risen.
Task 3.1.1b (3 points). After that, a group of citizens of country B (which may include
former emigrants from A) emigrated to country A. Is it possible that the ratings
of both countries rose again?
Task 3.1.1c (2 points). A group of citizens of country A emigrated to country B, and a
group of citizens of B emigrated to country C. As a result, the rating of each country turned out to be higher
than the initial ones. After that, the direction of migration flows changed to the
opposite — part of the residents of C moved to B, and part of the residents of B moved to A. It turned out that,
as a result, the ratings of all three countries rose again (compared to those that were
in effect after the first move but before the start of the second).
(At least, that is what these countries' news agencies claim.) Can this be so (if yes, how, and if not,
why)?
(It is assumed that during the period under consideration, the citizens' Q values did not change, and no one died or was born.)
SOLUTION:
a) Suppose, for example, that only two people lived in A, with scores 3 and 5, and in B - one
person with a score of 1. After the person with score 3 moves from A to B, in both countries
the rating will increase.
b) First, note that if the entire population of a country is divided into two groups X and Y with ratings respectively  ,
,
then the rating Q of the whole country lies between  (moreover, equality holds only when QX = QY).
Let us denote by a and b the ratings of countries A and B before the emigration from A to B, and by a1 and b1 -
the ratings of these countries after this emigration, and by c - the rating of the group of emigrants. By
hypothesis a < a1. From this, as shown above, it follows that c < a < a1
(before emigration, A is divided into a group of emigrants with rating c and a group of those remaining with rating a1).
Similarly, b < b1 < c. So, b < a and b1 < a1. The first inequality shows that
an increase in the ratings of both countries is possible only when emigrating from the country with the larger
rating to the country with the smaller rating. The second inequality shows that the rating
of country A remained higher than the rating of country B. Thus, a simultaneous increase
in the ratings is impossible when emigrating from B to A.
c) Suppose country A has only two residents with scores Q = 1 and 2, country B has four
residents (Q = 2, 2, 4, 10), and country C has one resident (Q = 1). During the first wave of emigration from
A to B, one person with Q = 1 emigrated, and from B to C - two people with Q = 2. During the second wave, from C to
B, one person with Q = 1 moved, and from B to A - two people with Q = 1 and 4. The countries' ratings then
changed as follows: 
Grading criteria:
• (a) any correct example is given - 1 point
• (b) the proof is based on an incorrect statement, but can be brought to a correct one - 1 point
◦ the proof uses correct statements that are not proven - 2 points
◦ a complete proof - 3 points
•(c) an example of how this is possible is given - 2 points
Problem 3.1.2 (6 points)
The administration of the VKontakte social network decided to create a community «Of all those who have less than half of their friends in this community». To do this, they need to include users in the community so that, in the end:
for everyone who is in this community, less than half of their friends were in it as well;
for everyone who is not in this community, not less than half of their friends were in it.
Will they always succeed in creating such a community?
(It is assumed that users do not join the community themselves, but are assigned by the social network's administration)
SOLUTION:
Let us represent the social network as a graph. The vertices are users, the edges are
friendship relations. Then we need to prove that any graph can be colored in two colors:
blue and red, so that
less than half of the neighbors of blue vertices are blue
not less than half of the neighbors of red vertices are blue
Let's color the graph somehow. Now we will recolor the vertices for which the condition is not satisfied.
If we recolor a red vertex (it has fewer than half blue neighbors), the number of edges between blue and red vertices increases.
If we recolor a blue one (it has not less than half blue neighbors),
the number of edges between blue and red vertices does not decrease, while the number of red vertices increases. Therefore, the recoloring cannot go on forever. This means that at some point the necessary conditions will be satisfied for all vertices.
Answer: yes, always
Grading criteria:
• it is proven that this is possible in any network — 6 points
• there are correct invariant ideas, but there are gaps in the proof — 3 points
3.2. Computer science problems
Problem 3.2.1 «Ads Everywhere» (1 point)
A long time ago, Pasha created his own internet portal. Now his site has become fairly popular, and the young man decided it was time to monetize it. More specifically, he decided to introduce advertising. Pasha doesn't trust standard solutions, so he decided to write his own small advertising platform.
The site has N ad slots. For each slot, its profitability v_i is known - namely, how many times it was clicked over the last month (the number of clicks does not depend on the content of the ad). Through the application form, Pasha received M ads from advertisers. Each advertiser specifies for their ad a price c_i in rubles that they are willing to pay per 100 clicks.
Pasha believes that the more an advertiser is willing to pay, the more profitable
the position his ad should occupy. If there are too many ads, then the ads with
with a very low price will not be shown, and if there are too few ads, then the
least profitable slots will remain empty.
You are required to match the ads and the ad slots on the site in
accordance with Pasha's principles.
Input format:
The first line contains two numbers
 N — the number of ad slots
on the site, and M — the number of ads. The second line contains N
numbers vivi, separated by spaces. The number 0≤v_i≤5000 characterizes the profitability of the i-th ad. In
the third line, separated by spaces, are M numbers 0≤c_j≤10000. The number c_j shows the price that
the advertiser is willing to pay for 100 clicks on the j-th ad.
Output format:
Print N lines; in each line print a pair of numbers: the profitability of the ad
slot and the price per 100 clicks of the corresponding ad that will
be placed in this slot. If there were not enough ads for this position, instead of
the ad's number, specify -1.
If there is more than one solution, print any of them.
METHOD OF EVALUATING THE WORK:
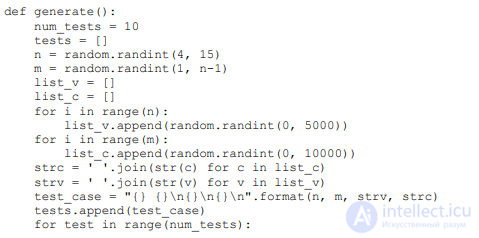
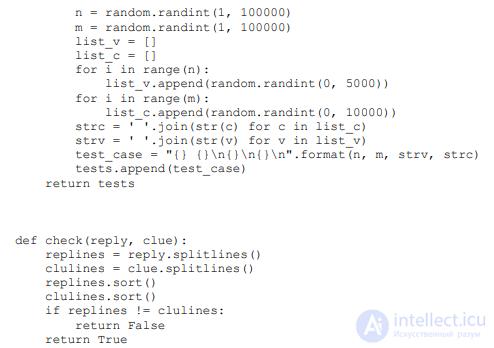
The following code in Python is used to generate a unique test case and check the
result. The function generate returns a set of tests and the correct answers:
SOLUTION:
This problem uses the idea of greedy algorithms. By the conditions, we match
the maximum element from the set of ads with the maximum element from the set
of ad slots. The second most expensive ad is placed in the second most valuable slot. And
so on. Therefore, it is enough to sort both arrays in ascending order and take
the first N pairs of elements. It is necessary to take into account that if M < N, then in the last M-N
records, -1 must be printed instead of the price c.
Implementation of this algorithm in the Python programming language:

Problem 3.2.2 «Who in the World is the Smartest of All?» (1 point)
Data research requires attention to detail and diligence, even if not a
very great deal of it. Today, a file has come into your hands with data that the district administration
collects about all students. Much of this data can reveal to specialists
information about which factors, and how, affect students' good academic performance.
At the moment, the district administration is interested in two questions:
first, it is important for them to know the average age of schoolchildren who attend
extra classes at schools. And second, the last name and first name of the schoolchild with
the maximum score in chemistry, among those who study in the 8th or 9th grade.
Input format:
The first line specifies the number of schoolchildren 1≤N≤10^5, whose data the school has collected.
The next N lines contain data about the students. Each line has the form ['Name',
'Last name', 'Patronymic', number of full years, ['school (number or name)', grade, vacation type
('t'/'q')],
[average grade in mathematics (a number from 1 to 10), average grade in Russian language
(a number from 1 to 10), average grade in physics (a number from 1 to 10), average grade in chemistry (a number
from 1 to 10), average grade in biology (a number from 1 to 10)], the number of extra
classes at school, the number of children in the child's family].
Output format:
In the first line, print the average age of the schoolchildren who attend
extra classes at school, rounded down to the nearest integer. In the second
line, separated by a space, print the last name and first name of the schoolchild with the maximum score in chemistry,
among those who study in the 8th or 9th grade. If there are several children with the same score, print
the one recorded earlier in the file. If the answer to a question cannot be correctly
obtained, replace the missing answer with the string "No answer".
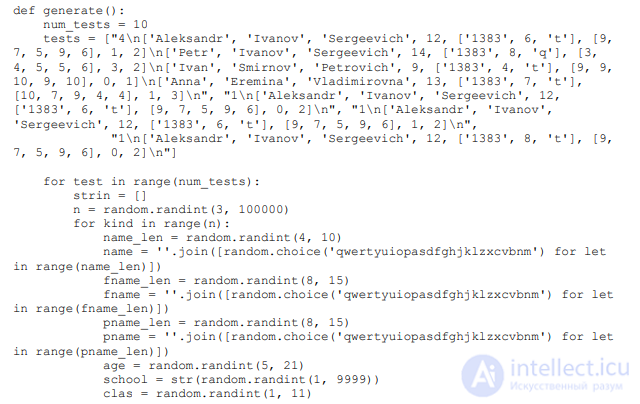
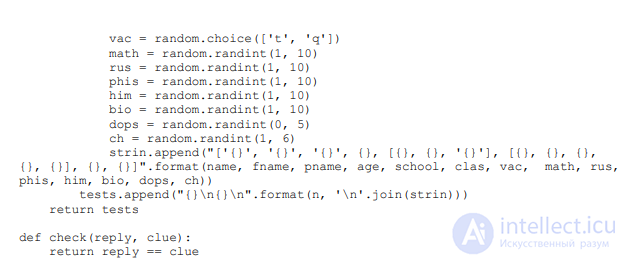
METHOD OF EVALUATING THE WORK:
The following code in Python is used to generate a unique test case and check the
result. The function generate returns a set of tests and the correct answers:
SOLUTION:
Since the task of finding the maximum, minimum, and average value on
an unsorted data stream can be solved in time comparable to the time
needed for reading, a good solution reads the student data line by line. Before
reading the k-th line, a good solution knows the answer for a file consisting of the first k-1
lines of the source file. At the k-th step, it is necessary to extract the data from the line and update
the following variables according to the conditions:
the number of schoolchildren who attend extra classes;
the total age of schoolchildren who attend extra classes;
the last name and first name of the 8th-/9th-grader with the maximum score in chemistry;
the maximum score in chemistry among 8th-/9th-graders.
When all records have been processed, it is necessary to check that there exists at least one
8th/9th-grader, and that there exists at least one schoolchild who attends extra classes. If
no such schoolchildren exist, then it is necessary to print “No answer” for the corresponding
question.
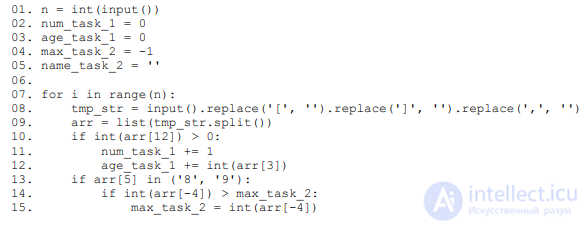
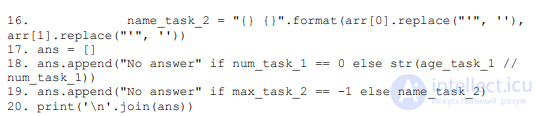
Implementation of this algorithm in the Python programming language:
Problem 3.2.3 «Volunteer Cleanup Day» (3 points)
Next weekend, students from all grades will go to the park for a volunteer cleanup day.
The students want to divide themselves into teams. It was decided that in order to get into
a particular group, a schoolchild must necessarily have at least one
friend in that group. It is assumed that if the first schoolchild is friends with the second, then the second is also friends with the first.
Each team will go to the cleanup day on a separate bus, so the number of teams
must be minimal.
All that remains is to order the buses and make a list for each bus of which
students are riding in it. Write a program that solves this problem.
Input format:
The first line specifies two numbers: N — the number of schoolchildren, M — the number of lines
describing the friendship relations between schoolchildren, 0≤N,M≤1000. In the following M
lines, pairs of natural numbers 1≤a,b≤N are given, meaning that schoolchild number a is friends
with schoolchild number b.
Output format:
In the first line, print T — the number of buses. In the following T lines, print
information about the schoolchildren riding in the buses, in increasing order of
schoolchildren's numbers. On the second line, indicate in square brackets the number of schoolchildren, then, separated by
space, in increasing order of the numbers of the schoolchildren riding on the first bus, if
necessary; on the third line — in square brackets, the number of schoolchildren, then the numbers
of the schoolchildren riding on the second bus, and so on. Each schoolchild must
be present in one and only one bus. If several answers are possible,
print any of them.
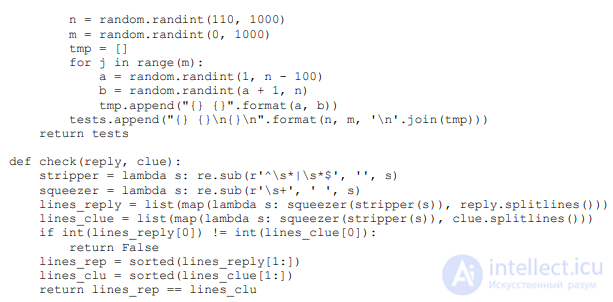
METHOD OF EVALUATING THE WORK:
The following code in Python is used to generate a unique test case and check the
result. The function generate returns a set of tests and the correct answers:

SOLUTION:
There is no maximum limit on the number of students riding in a
bus. From this premise, and the condition that the solution must have the minimal number of buses,
it is easy to derive the idea that the optimal solution will not split any pair of schoolchildren
who are friends with each other.
Thus, the essence of the problem is finding the connected components of
an undirected graph. This problem can be solved, for example, using breadth-first search
or depth-first search.
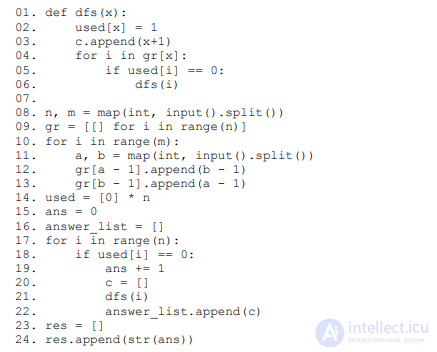
An example of a program implementing this algorithm, in Python:

Problem 3.2.4 «Final Assessment» (3 points)
The end of the year is a busy time not only for schoolchildren who are preparing for
exams, but also for the writers of exam questions. When composing any test,
it is necessary to take into account how difficult the problem will be for schoolchildren, and to determine
how many students will pass the test successfully.
This year, it was decided to hold a trial exam, inviting 100 students
from different schools to solve 5 problems. Each problem is worth ai points. A problem is either solved for
full points, or not solved at all, in which case no points are awarded for it. Partial
solutions are not taken into account by the graders. After the exam, the compilers received the
продолжение следует...
Часть 1 Machine Learning on Big Data: Theory and Worked Examples
Часть 2 Problem 3.2.5 «Minimum Spanning Tree» (4 points) - Machine Learning

Comments