
Lecture
Essentials: processors, devices, and connections
Process diagrams are used to show the allocation of processes to processors in the physical design of a system. A single process diagram shows one view of the process structure of a system. In developing a design, we use a process diagram to show the physical collection of processors and devices that support the system.
The essential elements of a process diagram are processors, devices, and their connections.
Processors. Figure 5-35 shows the notation for a processor. A processor is a piece of hardware capable of executing programs. Every processor must have a name; there are no particular restrictions on processor names, since they denote "iron" rather than software.
We may adorn the processor icon with a list of processes. Each process in such a list denotes either a main program (the function main from a module diagram) or the name of an active object (from an object diagram).
Devices. Figure 5-35 shows the notation for a device. A device is a piece of hardware that is not capable of executing programs (at least, not in our logical model). Like processors, devices require names, on which no significant restrictions are placed.
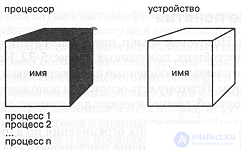
Figure 5-35. The processor and device icons of our logical model.
Connections. Processors and devices must communicate with one another. On a process diagram we draw the connections between them as undirected lines. A connection usually represents a direct hardware coupling, such as RS232, Ethernet, or even access to shared memory, but this coupling may also be indirect, for example "ground-to-satellite." Connections are usually taken to be bidirectional, but where necessary an arrowhead may be added to the notation to indicate direction. Any connection may carry an optional label naming it.
Example. Figure 5-36 presents an example of the use of this notation, describing the physical architecture of the greenhouse system. We see that the developers decided to use four computers, one serving as the operator's workstation and one for each greenhouse. The processes running on the computers dedicated to the greenhouses cannot communicate with one another directly, but only through the workstation. For simplicity, we have chosen not to show any devices on this diagram, although we assume that the system contains a large number of actuators and sensors.
Additional concepts
Notation. Figure 5-35 shows the standard notation we use for a processor and a device, but it is reasonable and even desirable to allow for variations on them. For example, one could introduce special icons for an embedded microcomputer (processor), a disk, a terminal, and a rectifier (devices), and use them on process diagrams instead of the standard ones. In doing so, we offer a visualization of the physical platform of our implementation aimed directly at technicians and systems people, as well as at the system's end users, who are probably not software development specialists.
Nesting. The physical configuration of a system may be very complex and may constitute a hierarchy of processors and devices. In such cases it is useful to be able to identify groups of processors, devices, and connections, just as class categories represent a logical grouping of classes and objects. We draw such groups as named dashed rectangles with rounded corners. We may expand such an icon on a process diagram and discover nested processors and devices. It is not difficult to define the connections among these groups.
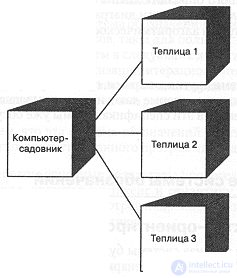
Figure 5-36. Process diagram of the hydroponics system with rounded corners.
Process scheduling. We must somehow define the order in which processes execute on each processor. There are five basic scheduling approaches, and on the diagram we can indicate for each processor which one is used, by adding one of the following names to its icon:
| ® Preemptive | A process with higher priority may take the processor away from an executing process with lower priority; usually processes of equal priority receive equal time slices for execution, so that computing resources are distributed fairly. |
| ® Nonpreemptive | The current process continues to execute on the processor until it itself relinquishes control of it. |
| ® Cyclic | Processes are given an equal amount of processor time in turn, usually called a time slice, at the end of which control is passed to another process. A process may receive time in slices and subslices. |
| ® Algorithmic | Process switching is governed by some algorithm. |
| ® Manual | A user outside the system controls process switching. |
For a more detailed description of process scheduling on a particular processor it is sometimes useful to provide an object or interaction diagram, especially if algorithmic switching is used.
Specifications. By analogy with the elements of other diagrams, processors, devices, and connections may have specifications that give their exhaustive definition. All the information included in these specifications has already been discussed in the present section.
5.8. Applying the notation
The products of object-oriented design
Typically, the results of analyzing a system will be sets of object diagrams (to express the system's behavior through scenarios), class diagrams (to express the roles and responsibilities of the agents that sustain the system's specified behavior), and state transition diagrams (to show the event-ordered behavior of these agents). The design of the system, which encompasses the development of its architecture and its implementation, produces class, object, module, and process diagrams, as well as dynamic views of those diagrams.
There is an end-to-end connection among these diagrams that allows us to trace requirements from the implementation back to the specification. Starting from process diagrams, one can find the main program, which is defined on some module diagram. That module diagram contains sets of classes and objects whose definitions we will find on the appropriate class or object diagrams. Finally, the definitions of individual classes point back to our original requirements, because these classes generally reflect the vocabulary of the problem domain directly.
The notation described in this chapter can be used by hand, although of course it positively invites automation. Automated design tools can be charged with checking consistency, constraints, and completeness of documentation. They also help the developer browse the results of analysis and development easily and quickly. For example, looking at a module diagram, a developer may wish to find out how a particular mechanism is built, and an automated tool will help him locate all the classes declared in some module. And from an object diagram describing a scenario in which one of the classes is used, the developer can move to the inheritance structure of that class. Finally, if the scenario contains an active object, the developer can use an automated design tool to find the processor to which the corresponding thread of control is allocated, and see an animation of the behavior of the class's finite state machine on that processor. The use of automated tools relieves the developer of the burden of reconciling details, allowing him to concentrate on the creative aspects of the design process.
Scaling up and scaling down
We believe that the notation described here is suitable both for small systems containing a few classes and for large projects with several thousand classes. As we will show in the next two chapters, this notation is particularly well suited to organizing an iterative development process. The diagrams should not be treated as frozen dogma; on the contrary, they must continually reflect all the new decisions made during the design process.
We also believe that this notation is suitable for implementation in various object-oriented programming languages.
This chapter has described the principal products of the object-oriented design process, including their syntax and semantics. In the next two chapters the development process will be examined in more detail. The remaining five chapters recount the application of the method in practice.
Summary

Comments