
Lecture
Theory is theory, but from the standpoint of the practicing engineer no methodology, however elegant, offered by scientists is worth a brass farthing if it does not help in building real, working systems. The previous seven chapters were only a prelude to this part of the book, where we will examine applications of object-oriented analysis to the solution of practical problems. In this chapter and in the remaining four we will adhere to the following scheme: having examined the requirements for one system or another, we will formalize the problem using the standard notation, and then, in the course of object-oriented development, we will arrive at some solution. A number of the most diverse domains have been chosen as examples, including data processing, information systems, artificial intelligence, and control. Each of them has its own peculiarities. You will not find here a detailed description of the resulting solutions, since in this book we devote our main attention to analysis and design rather than to programming as such. We have, however, included a fairly complete description of the transition from analysis to design and then to implementation of the project, and we have also drawn attention to the most interesting aspects connected with the architectural peculiarities of the systems under consideration.
| Requirements for the Weather Monitoring Station
The system must provide automatic monitoring of the following primary weather parameters:
The system must provide a continuous display of the current values of all eight primary and derived parameters, as well as the current time and date. The user must be able to see the maximum and minimum values of any of the primary parameters over 24 hours, accompanied by information about the time at which the corresponding measurement was taken. The system must allow the user to calibrate the sensors against known reference values, and also to set the current time and date. |
8.1. Analysis
Defining the Boundaries of the Problem Under Consideration
The sidebar has acquainted you with the requirements for the weather monitoring system. This is a fairly simple problem, whose solution allows one to get by with only a few classes. An engineer not fully versed in all the particulars of object-oriented analysis may draw the hasty conclusion that in this case the simplest and most effective course would be to abandon the object-oriented approach. He will turn to a consideration of data flows and input/output values. Nevertheless, as we shall see later, even for such a small system it is better to introduce an object-oriented architecture, which will splendidly illustrate certain basic principles underlying object-oriented development.
We will begin our analysis by examining the hardware part of the system. This is a task of systems analysis. It includes such matters as the manufacturability and cost of the system, which lie beyond the scope of this book. In order to narrow the problem, restricting ourselves to the analysis and design of the software alone, let us make the following strategic assumptions about the hardware:
Figure 8-1 shows a diagram illustrating the composition of the hardware part of the system.
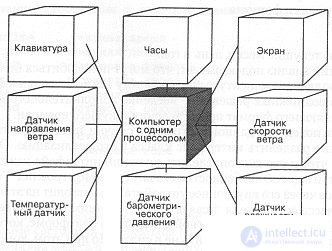
Fig. 8-1. The hardware of the weather monitoring system.
We decided to simplify the hardware model somewhat in order to devote more attention to the software part. Obviously, we could have refrained altogether from specifying the types of the command input and screen output devices, which would hardly have affected the architecture of the system. One of the features of the object-oriented approach is the striving to speak in the language of the problem domain, which makes it easier to draw parallels between the software abstractions and the key concepts of the original problem. Changes in the hardware affect only certain lower levels of the system.
As for the particulars of organizing input/output by means of memory mapping, we would not like to dwell on them in detail, since these details depend to a large degree on the way the project is implemented. We can easily isolate our software abstractions from these "uninteresting" details by hiding them in the implementations of the corresponding classes. For example, it makes sense to create a simple class for determining the current time and date: for this we must carry out a small analysis, in the course of which we will have to consider the roles and responsibilities of this abstraction [In fact, before creating a class, it is useful to rummage through the libraries available to you and try to find something similar there. A time and date class is a good candidate for reuse, and most likely someone has already developed and debugged such an abstraction. However, for the purposes of our exposition it is better to assume that no such ready-made class was found]. In particular, we might come to the decision that this class is responsible for keeping track of information about the current time in hours, minutes, and seconds, and also about the date (the current month, day, and year). As a result of the analysis we might also conclude that among the class's responsibilities two services must be singled out: providing information about the current time (currentTime) and about the current date (currentDate). The currentTime operation returns a text string of the following format:
13:56:42
showing the current hour, minute, and second. The currentDate operation returns a string of the following format:
3-20-98
showing the current month, day, and year.
Further analysis suggests that more complete abstractions may be needed, allowing the client to choose between the 12- and 24-hour time formats. One possible solution is the introduction of an additional modifier setFormat, which changes the format in which the current time is presented.
Having defined the behavior of this abstraction from the client's point of view, we then propose to separate the class interface and its implementation clearly. The basic idea is to define first the external interface of each class, without pondering the particulars of its internal structure. The implementation of the class interface through its internal structure takes place at the design stage. The implementation of a class provides the link between the external view of the abstraction and its embodiment on a specific hardware platform, which as a rule the software engineer is not in a position to change. But in doing this one must, of course, take care that the gap between the software abstraction and the internal structure is not too large and does not demand from the programmer enormous efforts to "glue together" utterly heterogeneous concepts.
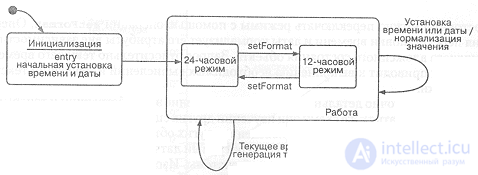
Fig. 8-2. The life cycle of the TimeDate class.
Let us assume that our hardware model provides access to the time and date as a 16-bit integer that shows how many seconds have passed since the computer was switched on [In the simplest case a hardware-implemented counter may be used, incrementing its value by one every second. A more sophisticated implementation may use a battery-powered time/date chip. In any case, the external appearance of this class (the contract with its clients) must be one and the same. Our implementation of the class is responsible for upholding this contract on the given hardware platform]. Then our time and date class must provide for converting this raw information into useful values, which in turn dictates the need to add new operations setHour, setSecond, setDay, setMonth, and setYear, which determine the current hour, second, day, month, and year on the basis of the primary data.
Now let us sum up. The abstraction of the time and date class looks like this:
Name:
TimeDate
Responsibility:
Maintaining information about the current time and the current date.
Operations:
CurrentTime - the current time
currentDate - the current date
setFormat - set the format
setHour - set the hour
setMinute - set the minutes
setSecond - set the seconds
setMonth - set the month
setDay - set the day
setYear - set the year
Attributes:
time - the time
date - the date
Instances of this class have a dynamic life cycle, which is reflected in the state transition diagram in Fig. 8-2. We see that when an instance of the class is initialized, the values of the attributes are zeroed out and an unconditional transition to the working state in 24-hour format mode takes place. In the working state the modes can be switched by means of the setFormat operation. The operation of resetting the time and date normalizes its attributes regardless of the object's current nested state. A query about the current time or date leads to the performance of the necessary computations and the generation of a text string.
We have defined the behavior of this abstraction in sufficient detail and can now use the same scheme in studying the other scenarios discovered during analysis. But first let us consider the behavior of the other objects in our system.
The class TemperatureSensor (temperature sensor) serves as the counterpart of the hardware temperature sensor of our system. An isolated analysis of the behavior of this class yields, to a first approximation, the following result:
Name:
TemperatureSensor
Responsibility:
Maintaining information about the current temperature.
Operations:
currentTemperature - the current temperature
setLowTemperature - set the minimum temperature
setHighTemperature - set the maximum temperature
Attributes:
temperature - the temperature
The name of the operation currentTemperature (the current temperature) speaks for itself. The purpose of the other two operations (setting the minimum and maximum temperatures) is directly determined by a requirement on the system, namely the need to carry out calibration of the sensors. The signal from each sensor is a fixed-point number from some working range, whose boundary values must be specified. Intermediate temperature values are computed by simple linear interpolation between these two points, as shown in Fig. 8-3.
The attentive reader may ask a legitimate question: why are we creating a special class for this abstraction, when the requirements on the system clearly state that there can be only one temperature sensor? That is true, but in order to make the abstraction reusable we nevertheless separate it out into a distinct class. In fact the number of temperature sensors ought not to affect the architecture of our system, and by separating out a distinct class TemperatureSensor we open up the possibility of using it in other programs of a similar type.
The abstraction for the barometric pressure sensor may look as follows:
Name:
PressureSensor
Responsibility:
Maintaining information about the current barometric pressure.
Operations:
currentPressure - the current pressure
setLowPressure - set the minimum pressure
setHighPressure - set the maximum pressure
Attributes:
pressure - the pressure
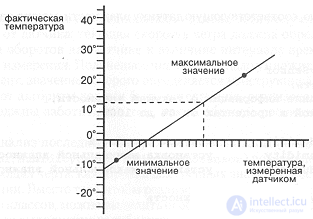
Fig. 8-3. Calibration of the sensor class TemperatureSensor.
However, on a more detailed examination of the requirements on the system it emerges that we have overlooked one important characteristic of the behavior of these classes. Namely, the requirements on the system provide for determining the tendencies of change in temperature and barometric pressure (the relative change, the trend). At the present moment (at the analysis stage) we will devote our main attention to the nature of this behavior and, most importantly, we will determine which abstraction should be responsible for it.
For both the temperature sensor and the pressure sensor, the trend can be defined as a real number varying in the range from -1 to 1 and representing the slope of the graph of the changes in temperature and pressure over some interval of time [A value of 0 shows that the temperature or pressure is stable. A value of 0.1 indicates a slight rise, a value of -0.3 corresponds to a sharp decrease. Values close to -1 and 1 hint at a natural cataclysm going beyond the bounds of those scenarios in which our system is supposed to work properly]. Thus, to the description of the two classes mentioned above one more responsibility and a corresponding operation can be added:
Responsibilities:
Determining the trend of pressure or temperature as the slope of the graph (in a linear approximation) of the change in their values over a given interval of time.
Operations:
trend - the trend
Having noted the similarity in the behavior of both classes, it would be reasonable to create a common superclass responsible for determining the trend. Let us call it TrendSensor.
Generally speaking, such a scheme is not the only one possible. We decided to assign responsibility for determining the trend to the sensors. We could have created a class external to the sensors, which would poll them periodically and compute the trend, but we rejected such a variant, since it would have complicated the system without justification. The original description of the temperature sensor and pressure sensor classes already implied the possibility of computing the trend "by their own means," and by identifying the commonality (by organizing the superclass TrendSensor) we obtained as a result a simple and cohesive system of abstractions.
The abstraction corresponding to the humidity sensor can be defined as follows:
Name:
HumiditySensor
Responsibility:
Maintaining information about the current humidity, expressed as a percentage from 0% to 100%.
Operations:
currentHumidity - the current humidity
setLowHumidity - set the minimum humidity
setHighHumidity - set the maximum humidity
Attributes:
humidity - the humidity
We are not set the task of determining the trend of humidity, and therefore the class HumiditySensor, unlike the classes TemperatureSensor and PressureSensor, is not a descendant of the class TrendSensor.
However, the requirements on the system imply the presence of common behavior for all three of the classes listed above. In particular, we must provide for displaying the maximum and minimum values of each parameter over 24 hours. This obligation can be reflected in the following description, common to all three classes:
Responsibility:
Generating reports about the maximum and minimum values of the parameters over 24 hours.
Operations:
highValue - the maximum value
lowValue - the minimum value
timeOf HighValue - the time corresponding to the maximum value
timeOfLowValue - the time corresponding to the minimum value
For now we will defer the question of how to implement this responsibility; we will return to it at the design stage. However, considering that this behavior is common to all three sensors, it appears expedient to organize one more superclass, which we will call HistoricalSensor. The class HumiditySensor is a direct descendant of the class HistoricalSensor, as is TrendSensor. The latter serves as an intermediate abstract class, transitional between the abstract HistoricalSensor and the concrete TemperatureSensor and PressureSensor.
The abstraction for the wind speed sensor may look as follows:
Name:
WindSpeedSensor
Responsibility:
Maintaining information about the current wind speed.
Operations:
currentSpeed - the current speed
setLowSpeed - set the minimum speed
setHighSpeed - set the maximum speed
Attributes:
speed - the speed
The requirements on the system do not assume the possibility of obtaining the speed directly from the sensor; the current wind speed must be determined as the ratio of the number of revolutions on the counter to the length of the time interval over which the measurements were made. The resulting number must then be multiplied by a calibration coefficient whose value is determined by the construction of the measuring device. This algorithm must naturally be implemented inside the class. Clients must not be concerned with how the current wind speed is computed.
A brief analysis of the last four classes of the system (TemperatureSensor, PressureSensor, HumiditySensor and WindSpeedSensor) shows that they have one more feature in common: calibration of the measured values by means of linear interpolation. Instead of implementing this capability separately in each of the classes, we can introduce a special superclass CalibratingSensor, responsible for performing the calibration.
Responsibilities:
Provide linear interpolation of values lying within a known interval.
Operations:
currentValue - the current value
setLowValue - set the minimum value
setHighValue - set the maximum value
CalibratingSensor is the immediate superclass of the class HistoricalSensor.
The last sensor to be considered - the wind direction sensor - differs somewhat from all the others, since it needs neither calibration nor the computation of minimum and maximum values. We can define this abstraction as follows:
Name:
WindDirectionSensor
Responsibilities:
Keep track of the current wind direction, given as a point on the compass rose.
Operations:
currentDirection - the current direction
Attributes:
direction - direction
To unite all the classes relating to sensors into a single hierarchy, it makes sense to create one more abstract base class, Sensor, which is the immediate superclass of WindDirectionSensor and CalibratingSensor. Figure 8-4 illustrates the complete hierarchy of sensor classes.
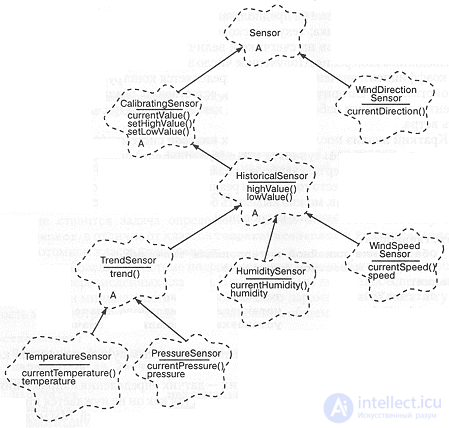
Figure 8-4. The hierarchy of sensor classes.
The abstraction for keyboard input has the following simple form:
Name:
Keypad
Responsibilities:
Keep track of the code of the last key pressed on the keypad.
Operations:
lastKeyPress - the last key pressed
Attributes:
key - key
Note that this class knows nothing about the purpose of any particular key: an instance of this class carries information only about which key was pressed. Responsibility for interpreting the keys rests with another class, which will be defined later.
The next abstraction is the class LCDDevice, intended to provide a certain degree of independence of our software system from the hardware on which it will run. For workstations and personal computers there exists a whole range of standards (although often conflicting with one another) for graphical interfaces, such as Motif or Microsoft Windows. Unfortunately, there are no generally accepted standards for embedded controllers, so analysis of the problem leads us to the conclusion that in order to solve it we must build prototypes and then determine the basic requirements for the user interface.
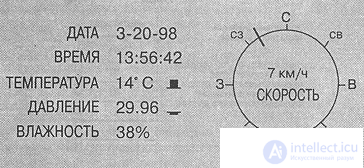
Figure 8-5. The weather monitoring station display.
Figure 8-5 shows one such prototype. It does not show the images characterizing wind chill and dew point that are required by the specification, nor such details as the 24-hour high and low limits of the measurements. All the main graphical elements are present, however. Thus, we must display on the screen text (in two different sizes and styles), circles, and lines of various thicknesses. It should also be noted that some elements of the image are static (such as the heading TEMPERATURE), while others are dynamic (the wind direction). Both the static and the dynamic elements of the image are generated by software. This simplifies the hardware (there is no need to order special liquid-crystal displays with built-in static elements), but somewhat complicates the software.
The graphics requirements can be expressed through the following abstraction:
Name:
LCDDevice
Responsibilities:
Manage the display of graphical elements on the screen.
Operations:
drawText - draw text
drawLine - draw a line
drawCircle - draw a circle
setTextSize - set the text size
setTextStyle - set the text style
setPenSize - set the line width
Similarly to the class Keypad, the class LCDDevice does not understand why it is displaying one element or another on the screen. This gives us the freedom to manipulate our abstractions, but it requires the presence of some external agent acting as an intermediary between the sensors and the display. We will postpone consideration of the corresponding abstraction until we have studied some scenarios of the system's operation.
The last class deserving attention is the timer. Let us make the simplifying assumption that there will be a single timer for the entire system, and that system interrupts will occur 60 times per second. It is better if the implementation details of such a timer are hidden from the remaining abstractions. To this end we can set up one more class that uses a callback function (the callback technique is explained in section 2.2) and exports only static class members (thereby imposing a constraint on the system that forbids the creation of more than one timer).
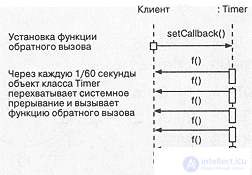
Figure 8-6. Interaction diagram for the timer.
Figure 8-6 shows an interaction diagram illustrating the use of this abstraction. It shows how a client interacts with the timer:
first the client passes the timer a callback function, and then, at intervals of 0.1 second, the timer invokes this function. In this way we relieve the client of any concern about how interrupts are handled, and the timer of the need to know what to do on such an interrupt. The only requirement placed on the client should be a limit on the execution time of the callback function - it must not exceed 0.1 second, otherwise the timer may miss an event.
The class Timer, which generates the interrupts, is an active abstraction; it initiates a chain of control commands. It can be formalized by means of the following description:
Name:
Timer
Responsibilities:
Generate interrupts and dispatch callback functions.
Operations:
setCallback() - set the callback function
Scenarios
Having defined the main abstractions within our system, let us continue the analysis of the problem and consider some scenarios of the system's operation. We begin by compiling a list of situations. From the user's point of view, the list will look roughly as follows:
Let us add two more situations:
Let us examine the above scenarios in order to understand the behavior (precisely the behavior, and not the internal structure) of the system.
The main task of the system is monitoring the basic measured parameters. One constraint is the impossibility of processing information at a rate exceeding 60 measurements per second. Fortunately, the weather parameters that interest us most change far more slowly. Further analysis shows that, in order to register changes in the various weather parameters in a timely fashion, it is sufficient to provide the following sampling rates:
Earlier we decided that the sensor classes should not be responsible for organizing periodic measurements. This work lies in the sphere of responsibility of an external agent interacting with the sensors. Let us postpone for now the description of this agent's behavior (it is determined to a greater degree by the specifics of the system's implementation and will be considered at the design stage). The interaction diagram given in Figure 8-7 illustrates to some extent a scenario of its operation. We see that when the agent begins processing measurements, it polls the sensors in turn, but in doing so it may skip those for which the sampling interval is greater than 0.1 second. Such a scheme, unlike one in which each sensor is itself responsible for the measurement, provides more predictable system behavior, because control over the process of reading the parameters is concentrated in one place, namely in an instance of the agent class. Let us call this class Sampler.
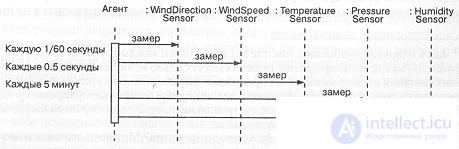
Figure 8-7. The measurement scenario.
Let us continue our consideration of this scenario. Now we must decide which of the objects shown in the diagram should be responsible for displaying information on the screen, that is, in effect, for passing the data to an instance of the class LCDDevice. Two options are possible here: we can assign responsibility for these actions to the sensor classes themselves (a scheme of this sort is implemented in architectures such as MVC), or create a separate class to connect the sensors and the display. In this case we choose the second option, since it allows us to isolate within a single class all the design decisions concerning the mechanisms for displaying the parameters on the screen. As a result, the description of one more class is added to the results of our analysis:
Name:
DisplayManager
Responsibilities:
Manage the display of the parameters on the screen.
Operations:
drawStaticItems - draw the static elements
displayTime - display the time
displayDate - display the date
displayTemperature - display the temperature
displayHumidity - display the humidity
displayPressure - display the pressure
displayWindChill - display the wind chill
displayDewPoint - display the dew point
displayWindSpeed - display the wind speed
displayWindDirection - display the wind direction
displayHighLow - display the maximum and minimum values
The drawStaticItems operation draws on the screen that part of the image which does not change during the system's operation, for example the compass rose used to indicate wind direction. We also assume that the displayTemperature and displayPressure operations are responsible for displaying the trends of the corresponding parameters on the screen (consequently, when we move on to implementing the design, we will need to work out suitable signatures for these operations).
Figure 8-8 shows a class diagram illustrating the relationships among the abstractions responsible for displaying information on the screen, and the role of each of them in supporting the given scenario.
Let us note one more important advantage of our decision to introduce a separate class DisplayManager. The task of localizing the system for various countries implies changing the language in which information is displayed. The presence of a separate class responsible for displaying messages on the screen substantially eases the localization process, since the names of all the messages (for example, TEMPERATURE, or speed) are in this case under the control of a single class; they are not scattered across a multitude of different abstractions.
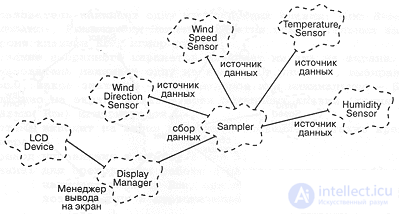
Figure 8-8. The classes responsible for displaying data.
Consideration of the localization problem raises a number of additional questions for the developer that are not expressed explicitly in the system requirements. How should the temperature be shown, in Celsius or in Fahrenheit? In what units should wind speed be displayed, in kilometers per hour or in miles per hour? Clearly, our software must not constrain us rigidly. To provide flexibility in the end user's use of the system, we must add to the descriptions of the classes TemperatureSensor and WindSpeedSensor one more operation, setMode, which sets the desired system of units. We should also add to the description of these classes a new responsibility, providing for the ability to place newly created objects into a known state. And, finally, we must change the description of the operation DisplayManager::drawStaticItems in such a way that when the units of measurement change, the display panel changes accordingly.
As a result, we will have to add one more scenario to the list of the system's operating modes:
We will postpone consideration of this mode until we have studied the other scenarios. Monitoring of the secondary parameters, in particular the temperature and pressure trends, can be provided on the basis of the protocols of the classes already presented earlier, TemperatureSensor and PressureSensor. However, in order to define the monitoring scenario completely, we will have to add two more classes (let us call them WindChill and DewPoint), intended for determining the wind chill and the dew point. These abstractions are not identified with sensors, or indeed with anything tangible. Their task is to compute the values of parameters. They act as agents collaborating with other classes. Specifically, the class WindChill uses for its computations the information contained in TemperatureSensor and WindSpeedSensor, while the class DewPoint collaborates with the classes TemperatureSensor and HimiditySensor. The classes Windchill and DewPoint also collaborate with the class Sampler, since they use an analogous mechanism for polling the sensors. Figure 8-9 illustrates the set of classes and the relationships among them that are needed to implement the scenario under consideration. It differs hardly at all from the class diagram given earlier in Figure 8-8.
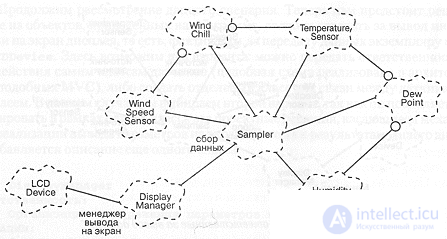
Figure 8-9. Secondary parameters.
Why did we decide to define WindChill and DewPoint as classes, instead of implementing the computation of the corresponding parameters by means of separate functions? Because each of them satisfies the conditions that allow them to be singled out as separate abstractions. Instances of these classes possess characteristic behavior (computing certain quantities by a certain algorithm), have at each moment in time a definite state (depending on the state of the sensors associated with them), and are unique (any association between instances of the wind speed and temperature sensors requires its own instance of WindChill). "Objectifying" these algorithmic abstractions increases the likelihood of their reuse in system architectures: the classes WindChill and DewPoint can easily be carried over from our application into other software systems, because each of them possesses a comprehensible external interface and stands out clearly as a separate abstraction.
Next let us consider various scenarios of interaction between the user and the system. Providing the user with an optimal sequence of actions for carrying out his tasks is, just like the design of a graphical interface, to a large degree an art. Study of this question lies beyond the scope of this book, but the main idea can be summed up briefly as follows: use prototyping, it substantially reduces the risk in developing a user interface. Moreover, if the system's architecture is object-oriented, then the costs associated with changing the organization of the user interface are reduced.
Let us consider some of the possible scenarios of the user's interaction with the system:
Displaying the maximum and minimum values of a selected parameter.
1. The user presses the SELECT key.
2. The system displays the message SELECTING on the screen.
3. The user presses one of the following keys: WIND SPEED, TEMPERATURE, PRESSURE, or HUMIDITY; presses of all other keys (except the RUN key) are ignored.
4. The name of the selected parameter begins to flash on the screen.
5. The user presses one of the keys UP or DOWN, thereby choosing which value - the maximum or the minimum - will be displayed on the screen; presses of all other keys (except the Run key) are ignored.
6. The system displays the selected value on the screen, together with the time at which it was measured.
7. Control passes to step 3 or 5.
Note: to end work in this mode the user presses the RUN key, whereupon the display screen returns to its original state.
After considering this scenario we come to the conclusion that it is necessary to extend the description of the class DisplayManager by adding to it the operations flashLabel (which toggles the display of a parameter's name into flashing mode and back, depending on the argument) and displayMode (which displays a text message on the display).
Setting the time and date follows an analogous scenario:
Setting the time and date.
1. The user presses the SELECT key.
2. The system displays the message SELECTING on the screen.
3. The user presses one of the following keys: TIME or DATE; presses of all other keys (except the RUN key and the keys listed in step 3 of the previous scenario) are ignored.
4. The name of the selected parameter, together with the first field of its value (for the time this is the hour, for the date the month), begins to flash on the screen.
5. The user presses one of the keys LEFT or RIGHT to move to another field; the user presses one of the keys UP or DOWN to increase or decrease the value of the highlighted quantity.
6. Control passes to step 3 or 5.
Note: to end work in this mode the user presses the RON key, whereupon the display screen returns to its original state, and the time and date are reset.
The sensor calibration scenario follows the same pattern:
Calibrating a sensor.
1. The user presses the CALIBRATE key.
2. The system displays the message CALIBRATING on the screen.
3. The user presses one of the following keys: WIND SPEED, TEMPERATURE, PRESSURE, or HUMIDITY; presses of all other keys (except the RUM key) are ignored.
4. The name of the selected parameter begins to flash on the screen.
5. The user presses one of the keys Up or DOWN, thereby specifying which calibration value, the maximum or the minimum, will be redefined.
6. The corresponding calibration value begins to flash on the screen.
7. The user presses the UP or DOWN keys to change the value of the highlighted quantity.
8. Control passes to step 3 or 5.
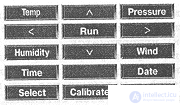
Figure 8-10. The keypad of the weather monitoring station.
Note: to end work in this mode the user presses the RUN key, whereupon the display screen returns to its original state, and the calibration function is recomputed.
For the duration of the calibration all instances of the class Sampler must stop reading the parameters, otherwise erroneous data will be shown. Thus, we must add two more operations to the description of the sampler class:
inhibitSample and resumeSample, which suspend and resume the process.
The last scenario concerns setting the units of measurement:
Setting the units of measurement for temperature and wind speed.
1. The user presses the MODE key.
2. The system displays the message MODE on the screen.
3. The user presses one of the keys WIND SPEED or TEMPERATURE; presses of all other keys (except the RUN key) are ignored.
4. The name of the selected parameter begins to flash on the screen.
5. The user presses one of the keys UP or DOWN, thereby changing the unit of measurement of the parameter.
6. The system changes the unit of measurement of the selected parameter.
7. Control passes to step 3 or 5.
Note: to end work in this mode the user presses the RUN key, whereupon the display screen returns to its original state, and the units of measurement of the parameters are reset.
After studying the operating scenarios we can determine the composition and layout of the keys on the keypad (a system decision). Figure 8-10 presents one version of such a decision.
The scenarios given above can be represented graphically by means of state transition diagrams. Since all the scenarios are closely related, it will be reasonable to introduce a separate class InputManager, defined as follows:
Name:
InputManager
Responsibilities:
Dispatch user commands.
Operations:
processKeyPress handling signals from the keypad
The single operation processKeyPress sets in motion the finite state machine that "lives" in an instance of this class.
As can be seen from Figure 8-11, which presents the state transition diagram of the class InputManager, there are four states: Running, Calibrating, Selecting, and Mode. These states correspond to the scenarios given above. The transition to a new state is determined by the first key pressed in the Running state. We return to the Running state after the Run key is pressed, whereupon the display is cleared.
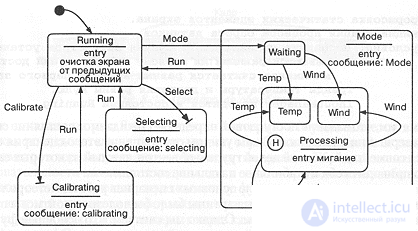
Figure 8-11. State transition diagram for InputManager.
We have described the system's behavior in the Mode state in greater detail (the right-hand part of the diagram) in order to show how the dynamics of a scenario can be formalized. On the transition into this state the corresponding message appears on the screen. Then the system enters the waiting state until the user presses one of the keys Temperature or WindSpeed, which move the system into the nested state Processing. If the user presses the Run key, the system returns to the main operational state. Each time it enters the Processing state the corresponding parameter begins to flash. On subsequent entries we go directly into whichever substate (Temp or wind) we left last time.
While in the Temp or wind states, the system can respond to the pressing of five keys: up or Down (moving between modes), Temp or wind (moving to the other nested state), and Run (exiting the Mode state).
The selecting and calibrating states can be described in a similar way. We do not present them here, because they add little to an understanding of the method [Naturally, when building a real product the detailed analysis must conclude with the drawing up of a state transition diagram. We can omit this part of the work here, because it is rather tedious and adds nothing new to our knowledge of the system].
The last main scenario relates to powering up the system. This requires us to ensure that all its objects are created in the proper sequence and brought into a stable initial state:
Powering up the system.
1. Power is switched on.
2. The sensors are created; sensors with history clear their "historical" data; sensors with trend initialize the trend computation algorithm.
3. The keypad buffer is initialized and cleared of any random information caused by noise at power-up.
4. The static elements of the screen are drawn.
5. The sensor sampling process is initialized.
Postconditions:
Note that specifying postconditions determines the expected state of the system after the scenario completes. As we shall see, the execution of this scenario is provided by the joint work of a whole group of objects, each of which independently brings itself into a stable initial state.
With this we conclude our study of the main scenarios of the weather monitoring station's operation. Of course, for the sake of completeness it would be useful to walk through some additional scenarios as well. However, we believe that the main functional properties of the system have already been covered in sufficient detail, and that it is now time to move on to designing its architecture and to justify our strategic decisions.

Comments