Lecture
Tom DeMarco writes in his book [1]: “A project without risk is the lot of losers. Risks and benefits always go hand in hand. ” In the first lecture, we already said that, due to the specifics of the industry, software engineering remains and, in the near future, will remain a production with a high level of risk. If you think about it, then everything that we are doing, managing a software development project, is aimed at combating risks, not meeting the deadlines, overspending resources, developing the wrong product. The definition of risk was given in a previous lecture.
Risk is a problem that has not yet arisen, and a problem is a risk that has materialized. The risk is characterized by the following characteristics [2] (Figure 24):
Risk is always probability and consequence. For example, there is always a chance that a meteorite will fall on the office of a software development center, and this will have disastrous consequences for the project. However, the likelihood of this event occurring is so low that in most projects we accept this risk and do not try to manage it.
Mike Newell, vice president of PSM Consulting, told how he explained to the audience in his lectures what risk is. He offers to play dice on such conditions, if there is a six on the cube, he wins. If it is any other number, then the listener wins. Rate of 1 dollar. Usually, most of the audience agrees to play on such terms. Mike raises the stakes: $ 10, $ 100, $ 1000. Gradually, the number of people who want to play is becoming less and less. At the rate of $ 1000, as a rule, there is no one willing to risk.
It is accepted [3] to distinguish two categories of risks:
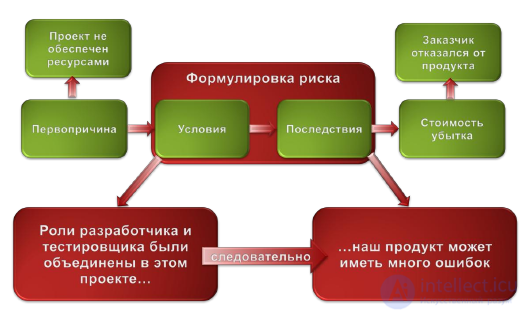
Figure 24. Example risk profile
Unknown risks are unforeseen circumstances. The only thing we can do in this case is to create a managerial reserve for the project budget in case of unplanned but potentially possible changes. The project manager is usually obliged to receive approval from the higher management for the use of this reserve. Management contingency reserves are not included in the basic plan for the cost of the project, but are included in the project budget. They are not distributed to the project as a budget, and therefore are not taken into account when calculating the amount used.
The motto of software developers from Microsoft [2]: “We do not fight risks — we manage them.” The objectives of project risk management are to reduce the likelihood and / or significance of the impact of adverse events for the project. Adequate risk management in a company is a sign of the maturity of production processes. Tom DeMarko writes [1]: “Considering only favorable scenarios and embedding them in the project plan is real childishness. And yet we do it all the time. ... If those who talk about possible problems before the opening of the project are called troublemakers, and those who deliver the project 2 months after the promised time, working at the same time 6080 hours a week, are heroes, then you have a bad team. ”
Refusing to manage project risks is the same as not having fire extinguishers and an evacuation plan in case of a fire in the cinema.
Risk management planning
Risk management is a specific activity that is performed in a project from its inception to its completion. Like any other work in a project, risk management takes time and resources. Therefore, this work must be planned. Risk management planning is the process of defining approaches and planning project risk management operations. Careful and detailed risk management planning allows you to:
Risk management planning must be completed early in the project planning stage, as it is essential for the successful execution of other processes.
In accordance with [3], the initial data for risk management planning are:
The risk management plan usually includes the following elements:
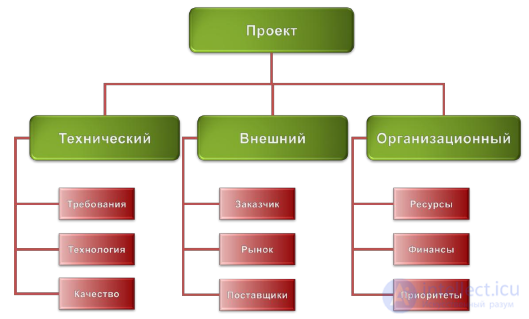
Figure 25. An example of a hierarchical project risk structure
The scale of impact assessment reflects the significance of risk (Table 2) in case of its occurrence. The scale of impact assessment may vary depending on the potentially affected risk objectives, type and size of the project, strategies adopted by the organization and its financial condition, as well as the organization's sensitivity to a particular type of impact.
| Weight | Value | Criterion |
|---|---|---|
| 3 | Catastrophic | Losses over $ 100K |
| 2 | Critical | Losses from $ 10K to $ 100K |
| one | Moderate | Losses less than $ 10K |
Table 2. Example of a risk impact assessment scale
Although the risk may affect the project terms and the quality of the product received, all these deviations can be evaluated in monetary terms. For example, the effects of a delay on customized development can be expressed in the amount of monetary sanctions defined in the contract.
A similar scale can be applied to assess the likelihood of risk occurring (Table 3).
| Weight | Value | Criterion |
|---|---|---|
| 3 | Very likely | Chances of offensive are very high. |
| 2 | maybe | Chances are equal |
| one | Little likely | The onset of the event is highly doubtful. |
Table 3. Example of a risk assessment scale
Another important risk characteristic is the proximity of its occurrence. Naturally, all other things being equal, the risks that can be realized already tomorrow should be given more attention today than to those that can occur no earlier than six months later. For the scale of assessing the proximity of risk, the following gradation can be applied, for example: very soon, not very soon, very soon.
Risk identification
Risk identification is the identification of risks that can affect a project, and the documentation of their characteristics. This is an iterative process that periodically recurs throughout the project, as new risks may be detected during its life cycle.
Baseline data for identifying and describing risk characteristics can be taken from different sources.
The first is the organization’s knowledge base. Information on the implementation of previous projects may be available in the archives of previous projects. It should be remembered that the problems of completed and running projects are, as a rule, risks in new projects.
Another source of information about project risks can be a variety of information from open sources, research papers, marketing analytics and other research works in this area. Finally, many programming forums can provide invaluable information about previously encountered problems in similar projects.
Each project is conceived and developed on the basis of a number of hypotheses, scenarios and assumptions. As a rule, the accepted assumptions are enumerated in the description of the project content - factors that are considered to be true, real or defined for the purposes of planning without invoking evidence. Uncertainty in project assumptions should also be considered as a potential source of project risks. Analysis of the assumptions allows you to identify project risks arising from inaccuracies, incompatibility or incompleteness of assumptions.
Different approaches can be used to collect risk information. Among these approaches the most common:
The purpose of the expert survey is to identify and assess risks by interviewing suitable qualified specialists. Experts express their opinion about the risks and give them an assessment based on their knowledge, experience and available information. This method can help avoid re-attack on the same rake.
Before the survey, the expert should receive all the necessary background information. Expert activities should be directed by asking questions. During the survey, all information provided by the expert should be recorded and stored. When working with several experts, the output information is summarized and communicated to all involved experts.
To participate in the brainstorming involved qualified professionals who are given a "homework" - to prepare their judgments on a certain category of risk. Then a general meeting is held, at which the specialists take turns to express their opinions on the risks. Important: Disputes and comments are not allowed. All risks are recorded, grouped by type and characteristics, each risk is defined. The goal is to make a primary list of possible risks for subsequent selection and analysis.
The Delphi method is a lot like a brainstorming method. However, there are important differences. First, when applying this method, experts participate in the survey anonymously. Therefore, the result is characterized by less subjectivity, less bias and less influence of individual experts. Secondly, the survey of experts is conducted in several stages. At each stage, the moderator sends questionnaires, collects and processes the answers. The survey results are sent to the experts again to clarify their opinions and ratings. Such an approach allows to reach a certain general opinion of specialists about risks.
To quickly identify risks, you can use another method of sociometry is known as the "Crawford cards" [5].
The essence of this technique is as follows. A group of experts of 7-10 people. Each participant of the mini-study is given ten cards (for this, it is quite suitable for ordinary paper notes). The facilitator asks the question: "What is the most important risk in this project?" All respondents should write down the most, in their opinion, important risk in this project. However, there should be no exchange of views. The facilitator makes a short pause, after which the question is repeated. The participant cannot repeat the same risk in the answer.
After the question is answered ten times, between 70 and 100 answer cards will be available to the presenter. If the group is well chosen (in the sense that it includes people with different points of view), the likelihood that the participants in the experiment will indicate the majority of the risks that are significant to the project is very high. It remains to compile a list of the above risks and distribute them to the participants for making changes and additions.
As a source of information in identifying risks, various available risk checklists of software development projects can be used, which should be analyzed for applicability to this particular project.
For example, Bari Boehm [6] lists the 10 most common risks of a software project:
DeMarco and Lister [1] list their own list of the five most important sources of risk for any software development project:
There are no comprehensive checklists of the risks of a software project; therefore, it is necessary to carefully analyze the features of each specific project.
The result of risk identification should be a list of risks with a description of their main characteristics: causes, conditions, consequences and damage.
If we go back to the example of the project for creating the “Automated System for the Sale of Documentation”, which we considered in previous lectures, the list of the main risks identified might look like this:
Table 4 List of risks of the project to create an “Automated System for the sale of documentation”
| Cause | Conditions | Effects | Damage |
|---|---|---|---|
| The requirements are not clear. | No description of system usage scenarios. | Delayed start of application software development. A large amount of processing. | Delays in the delivery of the finished product and additional labor costs. |
| Lack of qualified personnel. | The architecture and code are of poor quality. | A large number of errors. The high cost of fixing them. | Delays in the delivery of the finished product and additional labor costs. |
| Staff turnover. | Frequent change of team members. | Poor performance when entering new members into the project. | Delays in the delivery of the finished product and additional labor costs. |
The process of identifying risks is followed by a process of their qualitative analysis.
Qualitative risk analysis
Qualitative risk analysis includes ranking for identified risks. When analyzing probability and impact, it is assumed that no measures are taken to prevent risks.
Qualitative risk analysis includes:
For a qualitative assessment of the likelihood of risk realization and determining the severity of the consequences of its implementation, the scales generally accepted in the organization are used, examples of which we cited earlier.
To determine the risk rank, a matrix of probabilities and consequences is used (Figure 26). The risk rank is determined by the product of the weight of the probability and significance of the consequences.
There may, of course, be more complex scales for assessing probabilities, significance of consequences, and ranking of risks. There were scales that
contained up to 10 gradations. But, in my opinion, the most pragmatic approach is to use a three-level ranking.
Continuing to consider an example of a project to create an “Automated System for the sale of documentation”, the matrix of ranks of the main risks identified may look like this (Table 5).
Table 5. Matrix of ranks of the main identified risks of the project to create an “Automated System for the sale of documentation”
| Cause | Probability | Impact | Rank |
|---|---|---|---|
| Requirements are not clear | Very likely | Catastrophic | 9 |
| Lack of qualified personnel. | Very likely | Critical | 6 |
| Staff turnover. | maybe | Critical | four |

Figure 26. Risk rank and matrix of probabilities and consequences
Risk assessment requires accurate and adequate information. The use of inaccurate information leads to errors in the assessment. Incorrect risk assessment is also a risk.
The criteria for assessing the quality of the information used in the analysis are as follows:
The result of the qualitative risk analysis is their detailed description (Table 6).
Table 6. Sample risk description card
| Number: R-101 | Category: Technological. |
| Reason: Lack of qualified personnel. | Symptoms: Developers will use the new platform - J2EE. |
| Impact: Poor development performance | Impact: Increased development time and labor. |
| Probability: Very likely. | Impact level: Critical. |
| Proximity: Very soon. | Rank: 6. |
| Baseline: “Content of the project”, “Resource plan”, Minutes of meetings No. 21 of June 1, 2008, No. 27 of June 25, 2008. | |
The results of the qualitative analysis are used in the subsequent quantitative risk analysis and risk response planning.
Quantitative risk analysis
A quantitative analysis is made in relation to those risks that, in the process of qualitative analysis, were qualified as having a high and medium rank.
The following methods can be used for quantitative risk analysis:
A sensitivity analysis helps determine which risks have the greatest potential impact on a project. In the process of analysis, it is established to what extent the uncertainty of each element of the project is reflected in the studied objective of the project, if the remaining indefinite elements assume basic values. Results are presented, as a rule, in the form of a tornado diagram. Figure 27 presents an example of such a diagram, which reflects the influence on the workload of various factors by the professionalism of software developers [7].
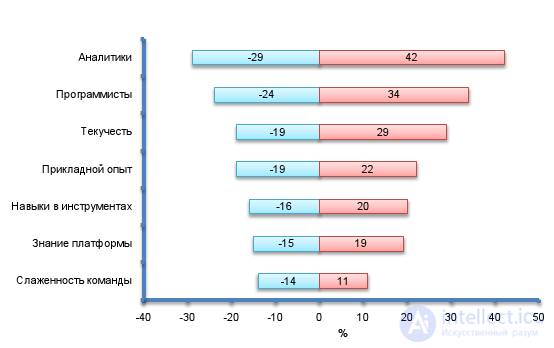
Figure 27. The influence of factors of professionalism of software developers on the project labor costs.
The analysis of the consequences of possible decisions is carried out on the basis of a study of the decision tree diagram, which describes the situation under consideration, taking into account each of the available options and a possible scenario. Figure 28 presents an example of a decision tree diagram on the arcs of which the probabilities and costs are put in case of the development of events under one or another scenario. The criterion for making a decision is the expected value of losses from its adoption.
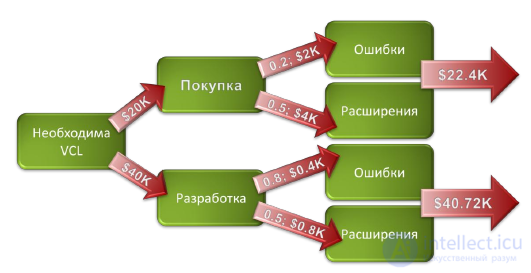
Figure 28. An example analysis of a decision tree when choosing to buy or produce the necessary library of visual components (VCL) for a project.
When modeling project risks, a model is used to determine the consequences of the impact of the detailed uncertainties on the project results in general. Modeling is usually performed using the Monte Carlo method.
An interesting example of such a model is the Riskology system from DeMarco and Lister, which illustrates the application of the Monte Carlo method to obtain information about the amount of time needed to overcome the impact of all uncontrolled project risks, given in the source [8]. The model allows to take into account five main (Figure 29) and five additional project risks.
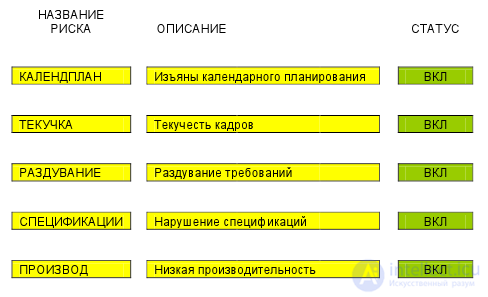
Figure 29. The five main risk factors of a software project that are considered in the Riskology model
The user can change the characteristics of the risks predefined in the Riskology system by setting the values of the minimum, maximum and most likely delay of the project due dates due to the influence of this risk. You can include additional own risks in the model. The result of the Monte Carlo simulation will be presented in the form of a histogram of the distribution of the completion time of the estimated project (Figure 30).
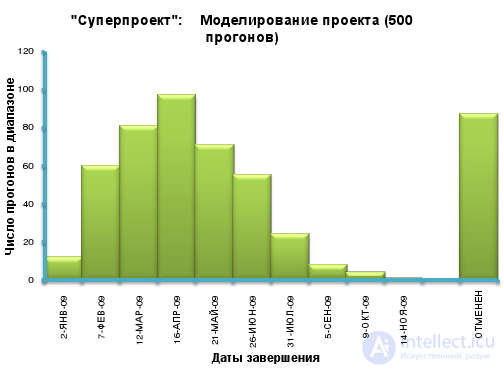
Figure 30. The histogram of the distribution of the possible completion of the project, calculated on the basis of Monte-Carlo simulation results
The diagram also shows the number of cases, approximately 80 out of 500 runs, in which the project, according to the simulation results, was canceled before its completion.
Comments
To leave a comment
software project management
Terms: software project management