Lecture
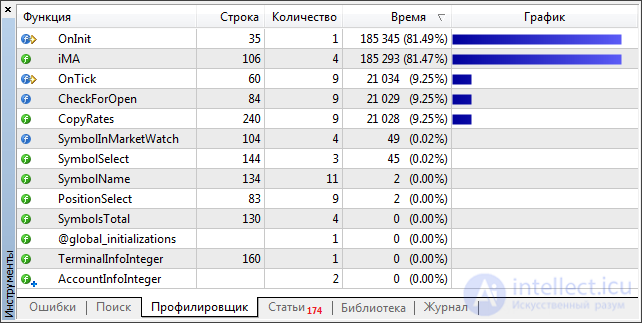
Profiling is a collection of program performance characteristics, such as the execution time of individual fragments (usually subroutines), the number of true predicted conditional jumps, the number of cache misses, etc. The tool used to analyze work is called a profiler or profiler. Usually performed in conjunction with the optimization program. 
Characteristics can be hardware (time) or caused by software (functional query). Program analysis tools are extremely important for understanding program behavior. Software designers need these tools to evaluate how well the work is done. Programmers need tools to analyze their programs and identify critical areas of the program.
This is often used to determine how long certain parts of a program run, how often they run, or generate a call graph. Usually this information is used to identify those parts of the program that work the most. These time consuming areas can be optimized to run faster.
Also, the Code Coverage analysis is the process of identifying unused portions of code using, for example, launching a program several times.
Comments
To leave a comment
Highly loaded projects. Theory of parallel computing. Supercomputers. Distributed systems
Terms: Highly loaded projects. Theory of parallel computing. Supercomputers. Distributed systems