
Lecture
In economics, a consumer usually evaluates a product through its price, quality, service life, convenience and utility. But there is another important parameter that often stays in the shadows: how much time the product is actually used.
For example, a car can be expensive, take up space, and require maintenance, insurance, repairs and fuel. Yet the average person is far from using it around the clock. If a car is used roughly 1 hour a day, then its actual time utilization is:
1 / 24 × 100% = 4,17%
That is, the car sits idle almost 96% of the time.
This does not mean the car is useless. But it reveals an interesting economic feature: many durable goods have a high cost of ownership but a low rate of actual use.
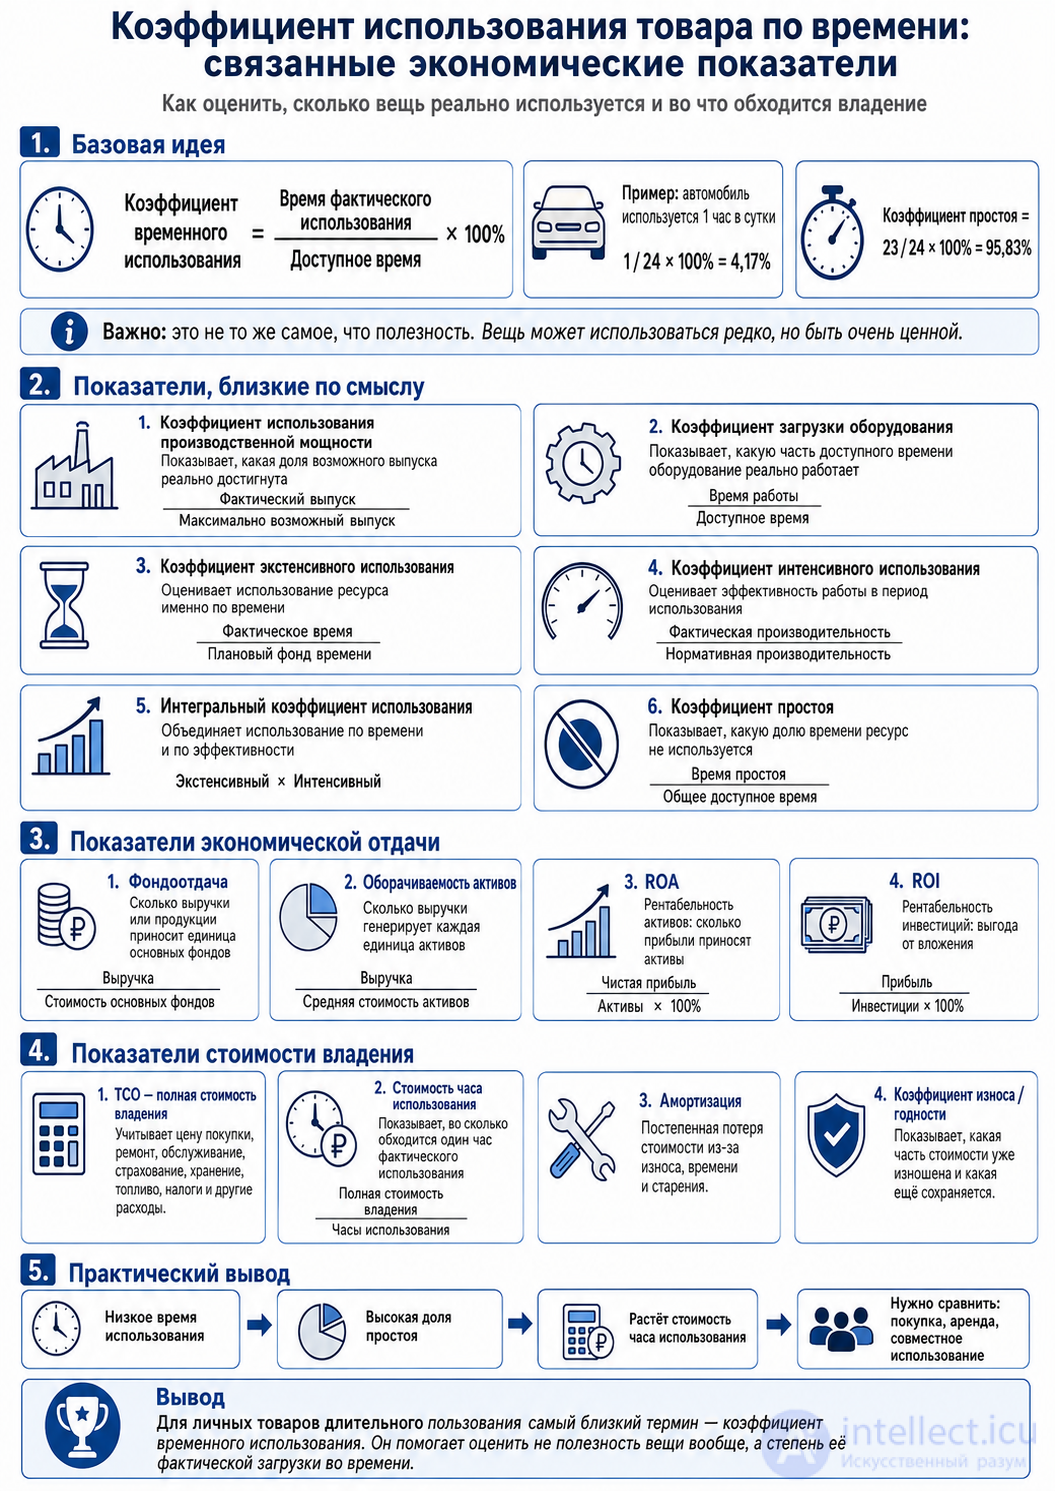
The time utilization rate of a product can be defined as the ratio of the actual time of use to the maximum available time.
Formula:
Kuse = Tactual / Tavailable × 100%
Where:
Kuse — the utilization rate
Tactual — the actual time the product is used
Tavailable — the total available time
For example, if a car is available to its owner 24 hours a day but is used for only 1 hour, then:
Kuse = 1 / 24 × 100% = 4.17%
If a laptop is used 6 hours a day:
Kuse = 6 / 24 × 100% = 25%
If a washing machine runs for 1 hour every two days, then its average daily use is roughly 0.5 hours:
Kuse = 0.5 / 24 × 100% = 2.08%
Such an indicator makes it possible to see how intensively an item is used over time.
It is important not to confuse the time utilization rate with the utility of a product.
Utility is the subjective value that a product gives a person. An item may be used rarely and still be very important.
For example:
Therefore a low utilization rate does not mean that a product is bad or unnecessary. It shows something else: how efficiently a resource is used over time.
Many expensive items are durable goods. They are bought not for one-time consumption but for repeated use over a long period.
Such goods include:
What is distinctive about such goods is that they have a long service life but are often used only occasionally.
For example, a personal car spends most of its time in a parking spot. A country house may be used only on weekends or in summer. An electric drill may sit in a cupboard for months. Skis may be used a few times per season.
From an economic point of view, this means that a product has a potential capacity for use, but only a small part of it is actually engaged.
For a more accurate assessment of a product, it is useful to count not only the purchase price but also the cost of one hour of actual use.
Formula:
Cost per hour of use = total cost of ownership / number of hours of use
Suppose a car costs its owner 6000 dollars a year. This includes depreciation, insurance, repairs, maintenance, parking and other expenses.
If the car is used 1 hour a day, then over a year this is:
365 hours
Then the cost of one hour of use is:
6000 / 365 = 16.44 dollars per hour
But if the car is used 3 hours a day, then over a year this is:
1095 hours
The cost of one hour of use will be:
6000 / 1095 = 5.48 dollars per hour
It turns out that the more intensively a product is used, the lower the cost of one hour of its useful work.
The time utilization rate helps to look differently at the economic rationality of a purchase.
For example, before buying you can ask yourself the following questions:
This logic is especially useful for expensive items that require maintenance and storage space.
The idea of a low utilization rate explains the popularity of car sharing, tool rental, coworking spaces and sharing-economy services.
If a personal car is used 4–5% of the time, then from an economic point of view there is enormous idle time in it. Car sharing tries to solve this problem: one car is used by different people at different times.
The same applies to tools. Buying a professional rotary hammer for the sake of a single renovation may not be worthwhile. Renting makes it possible to pay only for the actual time of use.
In other words, rental services turn a product from an object of ownership into a service of access.
The traditional model of consumption was built around ownership:
I bought the item — therefore it is mine.
But the modern economy increasingly offers a different model:
I do not necessarily have to own an item if all I need is access to its function.
A person may need not a car as an object but the ability to travel. Not a drill as an item but a hole in the wall. Not an office as property but a workspace for a certain amount of time.
From this point of view, the time utilization rate helps to understand when ownership is justified and when access, rental or shared use is more advantageous.
The time utilization rate has its limitations.
First, it does not account for intensity. A car may be used 1 hour a day but cover a long distance during that hour. A laptop may be switched on for 8 hours but actually be used for only part of that time.
Second, it does not account for the quality of the benefit. One hour of use may have different value. For example, a commute to work, an emergency trip to the hospital and a stroll around the city are situations of differing importance.
Third, it does not account for the psychological value of ownership. It may matter to a person to have an item “on hand,” even if it is used rarely.
Therefore the time utilization rate is better regarded not as a definitive measure of utility, but as one of the tools of analysis.
For a deeper analysis, one can combine time of use, cost of ownership and subjective benefit.
For example:
Efficiency of ownership = useful result / total cost of ownership
Or:
Cost per unit of utility = total cost of ownership / benefit received
In practice it is simpler to use two indicators:
1. The time utilization rate
2. The cost of one hour of use
Together they give a clearer picture.
For example:
Car:
utilization rate — 4.17%;
cost per hour of use — 16.44 dollars.
Laptop:
utilization rate — 25%;
the cost per hour of use may be far lower.
Drill:
utilization rate — less than 1%;
but renting may be more rational than buying.
Various names can be used for such an indicator:
The most precise and understandable name:
The time utilization rate of a product
And if the subject is expensive durable goods, a more economic variant can be used:
The load factor of a consumer asset
Below are the names of already existing economic ratios and indicators that are close to this idea of evaluating a product through time, use, efficiency and return.
Shows how much of the available capacity of an enterprise, equipment or resource is actually used.
Ratio = actual output / maximum possible output × 100%
For example, a plant may operate at 70% of its capacity.
In meaning this is very close to your idea: how much is really used out of what is potentially available.
Shows what share of the time the equipment is actually working.
Ratio = actual operating time / available working time × 100%
For example, a machine tool is available for 8 hours but works for 6 hours.
6 / 8 × 100% = 75%
This is an almost direct analogue for a car, only it is usually applied in manufacturing.
Shows how many shifts on average the equipment or production floor space is used for.
For example, if a machine tool works only one shift, the shift coefficient is lower than if it works two or three shifts.
It is used to assess the intensity of the use of fixed assets.
Shows the use of equipment in terms of time.
Ratio = actual operating time / planned or calendar time fund
This is one of the terms closest to your formula:
1 / 24 × 100% = 4,17%
That is, the car in your example has a low extensive utilization rate.
Shows not the operating time but how efficiently the equipment works while it is in use.
For example, a machine tool may work for 8 hours but turn out less output than it should according to the norm.
Ratio = actual productivity / standard productivity
For a car, the analogue would be not “how many hours it is used,” but “how efficiently it is used during a trip”: whether it carries one person or several, whether it drives empty or loaded, whether it performs a useful task or not.
Combines two indicators:
extensive use × intensive use
That is, it accounts for both the operating time and the efficiency of the work during that time.
For a car one could tentatively say:
Integral efficiency = share of time in use × usefulness of the trip
Shows how much revenue each unit of assets brings in.
Ratio = revenue / average value of assets
For example, if a company has 1 million dollars in assets and 2 million dollars in revenue, the asset turnover ratio equals 2.
This is no longer about time but about the economic return on property.
Shows how much output or revenue is generated by one unit of the value of fixed assets: buildings, equipment, transport.
Capital productivity = output or revenue / value of fixed assets
For a car used in business, the analogue would be:
how much income the car brings in per 1 hryvnia or 1 dollar of its value
For example, a taxi, a truck, a company car.
The inverse indicator to capital productivity.
Capital intensity = value of fixed assets / output of production
Shows how much capital must be invested in order to obtain a unit of output or revenue.
If capital intensity is high, it means the assets are expensive relative to the result.
Shows how much profit property or assets bring in.
ROA = net profit / assets × 100%
This is an indicator not of time of use but of the profitability of owning assets.
For example, if a car is used in a delivery business, one can calculate how much profit it brings relative to its value.
Shows how advantageous an investment of money is.
ROI = profit from the investment / amount of the investment × 100%
For example, if a car was bought for 20,000 dollars and it brought in 4000 dollars of net profit, the ROI will be:
4000 / 20000 × 100% = 20%
This is not exactly a ratio, but a very important economic indicator.
TCO shows how much a product really costs its owner over the entire period of use.
It includes:
For a car, TCO is often more important than the purchase price, because the expenses continue every year.
This too is not a classic “ratio,” but a very useful applied indicator.
Cost per hour = total cost of ownership / number of hours of actual use
For example:
The car costs its owner $6000 a year.
It is used 365 hours a year.

6000 / 365 = $16.44 per hour
This indicator complements your time utilization rate well.
Shows the gradual decline in the value of a product or asset due to wear, ageing and use.
For example, a car loses part of its value every year. Even if it stands still, it may become cheaper because of its age, obsolescence and market factors.
Shows what part of the value of fixed assets has already been “worn out” through depreciation.
Wear ratio = accumulated depreciation / original value × 100%
For example, if equipment cost 100,000 and depreciation is already 40,000:
40 000 / 100 000 × 100% = 40%
The inverse indicator to the wear ratio.
Serviceability ratio = residual value / original value × 100%
Shows what part of the asset's value is still preserved.
Shows how quickly inventories are converted into sales.
Ratio = cost of goods sold / average inventory
This is not about cars, but it is also about the efficiency of resource use: goods should not sit in a warehouse for long without moving.
Shows what part of the time a resource is not used.
Idle time ratio = idle time / total available time × 100%
For your example with the car:
The car is used 1 hour a day.
It sits idle 23 hours.

23 / 24 × 100% = 95.83%
This is the flip side of the time utilization rate.
If you want to link your idea to already existing economic terms, these are the best fits:
1. Equipment load factor
2. Extensive equipment utilization rate
3. Capacity utilization rate
4. Idle time ratio
5. Cost per hour of use
6. Total cost of ownership, TCO
For your idea I would use the name:
The time utilization rate of a consumer good
And if more strictly and economically:
The extensive utilization rate of a consumer asset
For a car:
K = 1 / 24 × 100% = 4.17%
And the inverse indicator:
Idle time ratio = 23 / 24 × 100% = 95.83%
The time utilization rate of a product shows what share of the time an item is really working or being used by its owner. The example of the car shows that with 1 hour of use per day its time utilization amounts to just 4.17%.
This indicator does not replace the concept of utility, because a product can be valuable even when used rarely. But it helps to better understand the economics of ownership: how much time an item sits idle, how much one hour of its use costs, and whether it makes sense to buy it rather than rent it.
In today's world, where many expensive goods are used for only a small part of the time, such an approach becomes especially important. It helps to move from the question “can I afford to buy this?” to a more precise question:
How rational is it for me to own this?

Comments