
Lecture
A reliability block diagram (RBD) — is a diagrammatic method showing how component reliability affects the success or failure of a redundant system. A reliability block diagram is also known as a dependence diagram (DD).
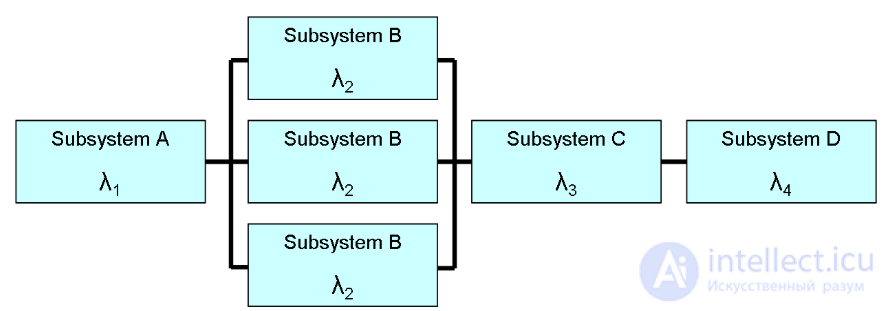
Reliability block diagram
A reliability block diagram (RBD) is depicted as a series of blocks connected in parallel or in series . Parallel blocks indicate redundant subsystems or components that help reduce the failure rate. Each block represents a system component with a certain failure rate . The block diagram indicates the type of redundancy in the parallel path. [ 1 ] For example, for the system to operate successfully a group of parallel blocks may require that two out of three components function correctly. Conversely, any failure in a series path leads to the failure of the entire series path.
A reliability block diagram (RBD) can be built using switches instead of blocks, where a closed switch represents a working component and an open one — a failed one. If a path through the network of switches can be found from the beginning to the end, the system still works.
Depending on how the probability tree (RBD) is defined, it can be converted into a success tree or into a fault tree. The success tree can then be converted into a fault tree or vice versa, by applying De Morgan's theorem .
Analytical solutions for evaluating an RBD are available when the blocks or components have statistical independence .
When statistical independence does not hold, special formalisms and solution tools must be considered, such as a dynamic RBD. [ 4 ]
The first thing to determine when calculating a reliability block diagram (RBD), — is whether to use probability or failure rate. Failure rate is often used in RBDs to determine the system's failure frequency. In an RBD, one should use either probability or failure rate, but not both at the same time.
The probabilities for each row are calculated by multiplying the reliabilities (probabilities) of the components in the row:

The probabilities of a parallel connection are calculated by multiplying the unreliability ( Q ) of the series-connected components, where Q = 1 – R, if the operation of only one element is sufficient for the system to work successfully:

At a constant failure rate, series rates are calculated by superposition of Poisson point processes for the series components:

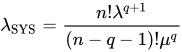
Parallel rates can be estimated using a number of formulas, including this formula [ 5 ] for all active blocks with identical component failure rates. Success requires n − q out of n redundant blocks. μ >> λ
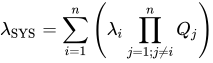
If the components in a parallel system have n different failure rates, a more general formula of the following form can be used. For a repairable model Q = λ / μ provided that μ≫λ .

Comments