
Lecture
The commodity market is defined as the sphere of circulation of a good that cannot be replaced by another good, or of interchangeable goods, within
whose boundaries (including geographical ones), based on economic, technical or other possibility or expediency, the buyer can
purchase the good, and such possibility or expediency is absent beyond its limits (clause 4, Art. 4 of the Federal Law “On Protection of Competition”). A similar definition of the market is contained in the Tax Code. The market for goods is recognized as the sphere of circulation of these goods, determined based on the possibility for the buyer (seller) to actually purchase (sell) the good, without significant additional costs, in the territory nearest to the buyer (seller) within the state or beyond its borders.
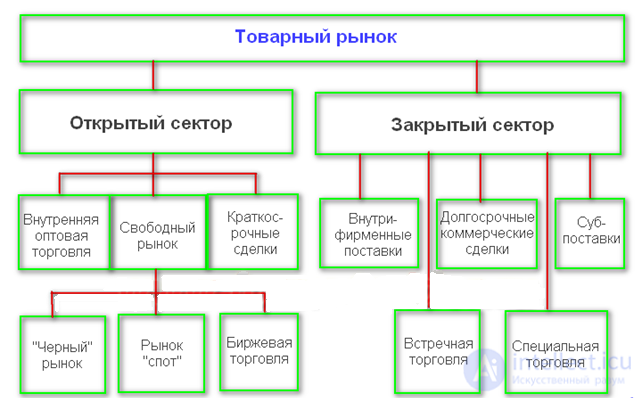
fig. structure of the commodity market
Analysis of the market structure sets the following tasks:
The study of macro- and micro-proportions of the market represents an
important and relevant task for both strategic and situational
analysis. The prevailing proportions are studied, but it is also necessary to
examine trends in dynamic changes in proportions, and to analyze
structural shifts and regional differences in market proportions.
From a methodological standpoint, it is important to assess the state of the competitive
environment, applying a comprehensive systemic approach. This procedure
consists of analyzing and evaluating information and statistical data
obtained from government bodies and economic entities, using
data from sociological surveys, expert opinions,
and the results of studies by scientific and public institutions.
Depending on the objectives set, the analysis of the competitive environment
can be carried out either sequentially or in separate stages,
each of which can functionally serve to address specific
tasks of antitrust regulation.
The result of the analysis is the compilation of a “portrait” of the commodity market
along lines, each of which is characterized by a set of
economic, technical-technological, and sociological parameters
(Table 1).
Table 1. Formation of the “portrait” of the commodity market
Market characteristics and Indicators
Product boundaries of the commodity market
Subjects of the commodity market
Geographic boundaries of the commodity market
Assessment of the market territory based on the principle of recognition by
buyers of equal accessibility of goods:
1) the possibility of demand shifting between territories,
included in a single geographic market;
2) availability of transport for moving
the buyer to the seller; the insignificance of transport
costs for moving the buyer to the seller;
3) the possibility of moving goods between territories,
included in a single geographic market;
4) the insignificance of additional costs for
transporting the good from the seller to the buyer;
5) preservation of the level of quality and consumer properties
of the good during its transportation; the absence in
this territory of administrative restrictions on the import
and export of goods
A comparable level of prices for the relevant goods
within the boundaries of this market
Volume of commodity resources in the market
Total volume of sales (supply) of the good by all
sellers within the geographic boundaries of the market to a designated
group of buyers
Share of an economic entity in the market
The ratio of the commodity output sold by the economic entity
to the total volume of sales
(supply) of the good
Market concentration of sellers of a good reflects the share
of large firms dominating a given market, or the share of large
firms in the industry that dominate in terms of output volume and,
accordingly, in terms of sales volume in the market. According to the paradigm
of “structure-conduct-performance”, monopoly power is directly
dependent on concentration. However, this relationship is not straightforward.
There are many other factors (non-strategic factors
of market structure) that do not depend on the deliberate actions of firms,
which determine the conduct and monopoly power of firms operating
in the market.
Market structure is not an exogenous factor of the economy and
is subject to the influence of the conduct of firms operating in the market. The structure
of the market has many facets, which is reflected in its various indicators.
The value of seller concentration in the market is extremely important for
determining market structure. However, seller concentration by
itself does not determine the level of monopoly power – the ability to influence the
price.
Only with sufficiently high barriers to entry into the industry
can seller concentration be realized as monopoly power –
the ability to set a price that ensures a sufficiently high
economic profit. We have characterized the main types of barriers
to entry into the industry, mainly non-strategic barriers that do not depend on the
deliberate actions of firms.
Definition of the indicator of firm size
Concentration indicators are based on comparing the size of a firm with
the size of the market in which it operates. The higher the size of firms
compared to the scale of the entire market, the higher the concentration
of producers (sellers) in this market. There are four main
indicators characterizing the size of a firm relative to the size of the market:
1) the firm's share of sales in the market volume of sales;
2) the share of employees at the enterprise in the number of those employed in the production
of this product;
3) the share of the value of the firm's assets in the value of the assets of all firms
operating in the market under consideration;
4) the share of value added at the enterprise in the sum of the value added
of all producers operating in the market.
The very size of the largest firms can in itself serve as a
characteristic of market concentration. It is precisely this criterion that underlies
the determination of a monopoly situation in Russia (evidence
of monopolism is control of not less than 35% of the market), and in the United Kingdom
(respectively, not less than 25% of the market).
Concentration indicators
There are two main parameters for assessing the level of market
concentration: the number of sellers in the market (producers in the industry)
and the distribution of the market shares of firms selling the good in the given
market. The level of concentration is considered higher if fewer firms
operate in the market. With the same number of firms in the market,
the level of concentration is higher the greater the unevenness in the
distribution of market shares.
Seller concentration reflects the relative size and
number of firms operating in the industry. The smaller the number of firms, the
higher the level of concentration. With the same number of firms in the market: the
less they differ from one another in size, the lower the level of
concentration.
The level of concentration affects the conduct of firms in the market: the higher
the level of concentration, the more firms depend on one another.
The outcome of a firm's independent choice of output volume and price
of its product is determined by the reactive response of competitors operating in the
market. The level of concentration affects firms' propensity for
rivalry or cooperation: the fewer firms operating in the market,
the easier it is for them to recognize their mutual interdependence, and the sooner
they will move toward cooperation. Therefore, one can assume that the higher
the level of concentration, the less competitive the market will be.
To use concentration indicators, one must
first answer two essential questions:
1) what are the boundaries of the market being analyzed?
2) what serves as the indicator of the “size” of a firm in the
market being analyzed?
To measure market concentration, indicators or
concentration indices are used. Requirements for an index:
1) it does not change depending on the size of the market;
2) it is easy to calculate and interpret;
3) its value changes from zero or a value close to it
(perfect competition) to one (monopoly).
The threshold market share - the simplest quantitative criterion,
exceeding which allows classifying an enterprise as a category of
monopolists or as occupying a dominant position in the market.
A similar approach took place in the United Kingdom at the start
of implementing antitrust policy there. The first antitrust
law of 1948 prescribed informing the Monopolies
and Mergers Commission of all cases where the share of one firm
(a single monopoly) or a group of jointly acting firms
restricts competition, capturing not less than 1/3 of the total volume of the given
commodity market. The 1973 law lowered the threshold to 25%.
In Russia, a threshold of 35% applies. Those enterprises that exceed
this share are included in the State Register of Monopolist Enterprises.
There are differences in the use of this threshold criterion in
English and Russian practice. In England, the threshold level (a third or a
quarter of the market) was applied above all to control the group
activity of independent companies. It was precisely the facts of such conduct
that were subject to registration with subsequent review in a special court.
Individual firms, even if they had a higher market share than the threshold,
were not included in any register at all.
In each specific case their conduct, insofar as it restricted
competition, was investigated separately, which often took several
years. Moreover, the 25% threshold market share applied not only to
sellers, but also to buyers of the given good, whereas
under Russian legislation the 35% threshold applies only to the
seller (producer).
The concentration ratio (CR). This indicator equals the sum of the
shares of the good's sales in the market held by several of the largest market participants.
The concentration ratio (index) for the m largest of the total number (n)
of companies producing the given good is calculated as the sum of the m
market shares (ki) of these companies.
The previous indicator – the threshold market share - has one
drawback: it applies to an individual enterprise and, in essence, does not provide
a characterization of the structure of the market for the given good as a whole. This shortcoming
is to a certain extent overcome by the concentration ratio, which
characterizes the share of several of the largest firms in the total market volume, in
percent. It is considered that if the concentration index approaches 100, then
the market is characterized by a high degree of monopolization, while if it is
only slightly above zero, it can be regarded as competitive.
The concentration index has long been used by economists to
study market structure. It is one of the most widespread
indicators, used in many countries of the world. For example, in
Germany a monopoly position of companies in the market arises if:
- one enterprise accounts for more than 1/3 of the total market turnover;
- 3 or fewer enterprises account for 50% of total turnover;
- 5 or fewer enterprises account for more than 2/3 of turnover.
In the USA, for several decades the indicator of the share of the
four largest enterprises was applied. In the period 1968-1982, the calculation of such an
index for the four largest companies in various industries
was used by the US Department of Justice as a benchmark in assessing
the permissibility (or impermissibility) of mergers. The US Statistical
Yearbooks regularly published data on the share of the 4, 8, 50 and 100
largest companies in the production of the most important types of products.
However, the share of a fixed number of enterprises has one
drawback: the indicator characterizes not the entire set of enterprises in the
market and its structure, but only the positions of the largest producers. It does not
take into account the peculiarities of market structure "on the periphery" of the industry.
Moreover, the concentration index can smooth over differences even within the
"core" of the market. For example, two industries may have the same concentration
index – 80%. But in one industry the "core" consists of 4 firms,
each of which controls 20% of the market, while in the other "core" there are
4 firms, which control respectively 55%, 20%, 4% and 1%
of the market. As we can see, in this case we have clear dominance of the leading
firm.
When calculating the concentration index, the market share that is
covered by imports is not taken into account. This is the main reason why the index
is practically inapplicable to assessing regional and local market
structures. Nevertheless, it remains a fairly acceptable indicator,
capable of distinguishing oligopoly from perfect and monopolistic
competition in an industry.
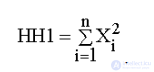
The Herfindahl-Hirschman index. This index
is defined as the sum of the squares of the shares of a good's sales in the commodity
market, expressed in percent, accounted for by each market participant:
.
The shortcomings inherent in the concentration index, and the criticism of its
use in conducting antitrust policy, led to the fact
that in June 1982 the US Department of Justice officially abandoned
this indicator and adopted the Herfindahl-Hirschman index as the main characteristic
of market structure.
The index characterizes the distribution of "market power" among all
participants of the given market.
The maximum value that this index can take
corresponds to a situation in which the market is fully monopolized by one
firm. In this case, obviously, HH1 = 100² = 10000.
If the number of firms in the given market is greater than one, then the index can
take various values depending on the distribution of market
shares. Suppose, for example, that 100 firms operate in the given market. Let us consider
two extreme cases. If one giant accounts for 90.1% of the sales
volume, and the share of each of the remaining 99 firms is only 0.1% of the total
volume, then
HH1 = 90.1² + 99*0.1² = 8119.1.
If, however, the market shares of all 100 firms are equal and each accounts for 1%
of the total market volume, then
HH1 = 100*1² = 100.
Since 1982, the Herfindahl-Hirschman index has become the main benchmark
of antitrust policy in the USA with regard to assessing the permissibility
of various kinds of mergers. It is used to classify mergers into three
large groups depending on the value of the index.
HH1<1000. The market is assessed as unconcentrated, and the merger,
as a rule, is allowed without hindrance.
1000 concentrated. However, if HH1>1400, an additional
check of the expediency of the merger by the Department of Justice is required. In
any case, such a level of the index (1400) raises concern and
is regarded as a kind of warning signal.
IHH>1800. The market is considered highly concentrated. With regard to
mergers in this range of values (1800-10000), three rules apply:
1) if as a result of the merger HH1 increases by no more than 50
points, the merger is usually permitted;
2) if, however, it increases by more than 100 points, the merger
is prohibited;
3) an increase of HH1 by 51-99 points usually becomes grounds
for an additional check of the expediency of the merger.
To accurately calculate the Herfindahl-Hirschman index, one must
know the market shares of all producers of the given good, and if the number of
producers in the market is very large, calculating the index becomes
practically impossible.
The Lind index. In EU countries, the Lind index is widely
used to analyze market structures. This index, like the concentration index,
is calculated only for a few (m) of the largest firms and,
consequently, also does not take into account the situation on the "periphery" of the market. However, unlike
the concentration index, it is oriented toward accounting for differences in the
"core" of the market.
Let us renumber the market shares of individual firms in order of
decreasing size, as when calculating the concentration index (CR): k1, k2, ..., kn.
Then the Lind index for the two largest firms will equal
the percentage ratio of their market shares:
IL = ( k1 / k2 )*100 %.
For example, if k1 = 50% and k2 = 25%, then IL = 200%.
In the case of m=3, the Lind index is defined as the arithmetic mean
of two ratios:
1) the ratio between the share of the largest firm and the arithmetic
mean share of the second and third largest firms;
2) the ratio between the arithmetic mean share of the two
largest firms and the share of the third largest firm.
For m=4, the Lind index is defined as the arithmetic mean
of the following three ratios:
1) the ratio between the share of the largest firm and the arithmetic
mean share of the next three largest firms;
2) the ratio between the arithmetic mean share of the two
largest firms and the arithmetic mean share of the third and fourth
largest firms;
3) the ratio between the arithmetic mean share of the three
largest firms and the share of the fourth largest firm.
The Lerner index. This is an indicator of a firm's market power. It
is used in economic theory to characterize the degree of
monopolization of an economy. It is assumed that as
monopolization increases, the gap between the price of a good and the marginal
cost of producing it widens. Under conditions of perfect competition, its
value equals 0. The Lerner index shows the relative excess
of the price of a good over the marginal cost of producing it.
The Lerner index as an indicator of the degree of market competitiveness has
the following form:
L=(P–MC)/P=-1/Ed ,
where Ed – is the price elasticity of demand for the given firm's output.
The value of the Lerner index can be directly linked to the
Herfindahl-Hirschman index for an oligopolistic market, by assuming that
it is described by the Cournot model. In this case, the industry-average Lerner
index (when the weights are the firms' market shares) will be calculated by the
formula:
L=-HHI/Ed ,
where HHI – is the Herfindahl-Hirschman concentration index.
The following interpretation has been proposed for the dependence of the Lerner index
on the level of concentration, taking into account the consistency of firms' pricing policy
(R. Clarke, S. Davies and M. Waterson):
for a firm: L = - b / Ed – ( 1 – b )* Y / Ed ,
for an industry: L = - b / Ed – ( 1 – b)* HHI / Ed ,
where b – is an indicator of the consistency of firms' pricing policy (the degree of
collusion), taking values from 0 (which corresponds to Cournot
interaction among firms) to 1 (which corresponds to the conclusion of a cartel
agreement).
The higher the indicator of pricing policy consistency, the less
the dependence of the Lerner index for a firm on its market share, and for the industry
as a whole – on seller concentration.
The collusion indicator itself was estimated by researchers on the basis of
building a linear regression showing the dependence of the Lerner index
for a firm on its market share:
Li = c + d *Yi
.
In this case:
b = c / (c+d).
This technique is based on the fact that under non-cooperative conduct
of sellers in the Cournot model, the value of the Lerner index depends linearly on
the firm's market share (the indicator c equals zero).
Conversely, within a cartel agreement, the Lerner index does not depend
on the firm's market share (since, under the profit-maximization condition of the
cartel, the marginal revenue in the market must equal the marginal
cost of each firm belonging to the cartel; consequently, the marginal
costs of the cartel members are assumed to be equal to one another).
According to researchers' estimates, in the 104 industries they examined,
the indicator of price conduct consistency varied from 0.039 to 0.536,
and the results obtained were in good agreement with other data
on the presence or absence of consistency in pricing and
output determination by sellers.
The relationship between the Herfindahl-Hirschman index and the Lerner
index is the main merit of the Herfindahl-Hirschman index from the
standpoint of economic theory. This property of it is widely used
in empirical research.
Qualitative indicators characterizing the structure of a commodity
market are:
1) the presence (or absence) of barriers to entry into the market for
potential competitors, and the degree to which they can be overcome;
2) the openness of the market to interregional and international
trade.
Potential competitors may be considered:
1) economic entities that have the material and
technical base, personnel, and technologies for manufacturing the given good, but
for various reasons do not realize these possibilities;
2) economic entities that manufacture the given good, but
do not sell it within the territory of the commodity market under study;
3) new economic entities entering the given commodity
market.
Barriers to entry into a commodity market are analyzed:
1) from the standpoint of the ability of potential sellers, including
those operating in adjacent markets, to become participants in
the commodity market under consideration;
2) from the standpoint of the ability of economic entities
operating in the commodity market under consideration to expand
production capacity or the sales volume of the given good.
The determination of barriers to entry into a commodity market is the procedure
of determining the circumstances or actions that prevent or
hinder and restrict economic entities from starting
activity in the commodity market (hereinafter - the determination of barriers to entry into the
commodity market). The following barriers to entry into the market for
potential competitors are analyzed.
Economic and organizational restrictions:
1) government policy in the field of investment, credit, taxes, prices, and tariff and non-tariff regulation of foreign economic activity, and the consequences of this policy for specific commodity markets;
2) the industry-average rate of profit;
3) the payback period of capital investments;
4) non-payments;
5) the presence (absence) of effective support for small business: availability of financing from a small business support fund, availability of credit resources for small businesses, and a low (high) level of rent for production and office premises. This type of economic barrier should be taken into account when analyzing those commodity markets in which small businesses are mainly represented;
6) the need to make significant initial capital investments with long payback periods for these investments;
7) limited availability of financial resources and higher costs of raising financing for potential entrants compared
with economic entities operating in the market under consideration;
8) exit costs from the market, including investments that cannot be recovered upon cessation of business activity;
9) the costs of gaining access to necessary resources and intellectual property rights, advertising costs, and the costs of obtaining information;
10) transport restrictions;
11) the lack of access for potential entrants to resources whose supply is limited and which are distributed among economic entities operating in the market under consideration.
Administrative restrictions. The presence (absence) is identified of
restrictions on the activity of sellers in a given commodity market,
imposed by authorities and administrative bodies at all levels and other bodies
and organizations vested with the rights of these bodies (not contradicting
antitrust legislation).
These include:
Underdevelopment of market infrastructure. The presence
(absence) is identified of the necessary means of communication (transport, telecommunications), services
for providing information, consulting, and leasing services, etc.
It is especially important to determine the conditions of transport accessibility of the given
market for potential competitors. The expediency of additional
transport costs for entering the market is correlated with the value of
the specific good, and the distance of transportation – with the qualitative and
technical characteristics of the good, which allow (or do not allow)
this transportation to be carried out.
The influence of vertical integration of organizations operating in the
market. The degree is identified to which sellers united into
vertical structures use all the advantages of intracorporate ties and
the impact of these relationships on competitors not belonging to these
vertical structures.
If, as a result of vertical integration, a new entrant could not
obtain the resources it needed or advertise its product
without also entering the upstream or downstream market, and
if such additional entry proves difficult for it, then
the barriers to entry increase.
The behavior strategy of firms operating on the market.
The pricing and marketing strategy of the leading sellers is analyzed,
along with their policy as holders of patents, licenses,
trademarks, and so on. The largest of the firms
operating on the product market have solid business ties
with suppliers of material and technical resources and with
the buyers of the goods produced, which gives them advantages
over potential competitors entering the product market.
The large scale of their business turnover, which determines a
corresponding mass of profit, allows them to build reserve
capacity and use preferential settlement terms with suppliers,
thereby pushing competitors aside. Large incumbent sellers
also have greater access to non-price methods of competition.
Among this type of barrier one should note the existence
(or absence) of long-term supply contracts with firms
already operating in the market, and their carrying out of
deliveries for government needs, and so on.
Special attention should be paid to analyzing instances of large
sellers using market power for anticompetitive purposes over the past 3–5 years, and to assessing the effect of this factor on the development of competition by surveying potential competitors
(sellers).
Barriers related to economies of scale. If the minimum efficient scale of operation in a given
product market is high (for example, production designed for
an output of 100 trucks a year is inefficient, and it
is economically justified to move to an annual output measured
in tens of thousands of vehicles), then potential competitors
entering the market, during the period needed to reach this
level, may face substantially higher costs than firms already
operating in the product market, and consequently be less
competitive. The time and costs needed to overcome this barrier
are assessed by surveying incumbent sellers, potential
competitors, and industry specialists.
Barriers based on an absolute cost advantage. These barriers
arise when the unit costs of firms already operating are
lower than those of firms newly entering the market. The
reasons for differences in cost levels may include: unequal
starting conditions of operation in the market, above all in
terms of assets and pricing; limited access for new sellers
to cheap and more convenient sources of raw materials;
the technological superiority of firms already operating in
the product markets; and the lower interest rate available
to them on borrowed capital, and so on.
Environmental restrictions. Instances are identified of prohibitions issued by
environmental safety agencies, environmental protection bodies, and
public organizations and movements against the expansion of the
scale of activity in this product market, construction of new
production and storage facilities, transport links, and so on.
Restrictions on demand. A high level of demand satisfaction,
reflecting both a high saturation of the market with goods and low
purchasing power among buyers, is a serious obstacle to
market entry by potential competitors. In this connection it is proposed,
where possible, to analyze the capacity of the product market separately – by
demand and by needs. As a source of information one should
use data from surveys of the main buyers of the product under study.
At the same time, when examining this type of barrier it is advisable to take into account the elasticity of demand in response to changes (reductions) in prices,
which should occur when new entities enter the market. If the
market becomes more competitive, prices should fall and,
correspondingly, demand should increase.
Capital expenditure barriers, or the amount of initial
investment needed to enter the product market. A significant
amount of initial capital, required to begin operating as an
economic entity on the market, may be one of the important
barriers to market entry. To analyze the situation, experts
estimate the amount of capital expenditure associated with
entering production of the product under study by potential
competitors (the cost of new construction, or of reconstructing
and technically re-equipping existing capacity that could be
adapted to produce this product, and the possibility of
covering these costs within a certain period of time).
The list of factors analyzed in the process of identifying
barriers to entry into a given product market may be broader
or narrower than those listed, and may differ from them owing
to industry-specific and regional characteristics.
Each type of market structure on which a firm operates
subsequently determines the strategy of its behavior in the industry.
The choice made by firms under perfect competition. In order
to maximize profit, the management of firms operating in a
perfectly competitive market should take fixed resources and
the costs associated with them as given, and decide on the
optimal volume of output based on the ability to change the
resources under its control.
Under perfect competition, when a firm cannot influence the
price of the product it sells, its only means of adapting to
market fluctuations is to change its volume of output.
The choice made by firms under monopolistic competition.
A key competitive feature of this market is the absence of
widely known leaders exerting a substantial influence on the
development of conditions and trends in the industry. Fierce
competition destroys weak, inefficient firms and leads to
greater concentration of production in large, powerful
companies. Often, for economic reasons, firms are unable
to destabilize the situation that has taken shape
this situation because none of them can radically change
the characteristics of the competitive environment. To obtain maximum
profit, a company operating in a market with monopolistic
competition must have a volume of output at which its
marginal revenue equals marginal cost. In a market with
monopolistic competition, companies resort to two strategies:
the first involves conducting massive campaigns to advertise its
products, the second involves supplying the market with new products that
differ from its own previous products and from competitors' products.
The choice made by firms under oligopoly. It is generally accepted that if, under oligopoly, firms earn
a profit exceeding the opportunity cost, they behave like a
pure monopoly; otherwise, they behave like firms operating
in a monopolistically competitive market.
Since an oligopolist's success can come at the expense of
weakening the positions of rival firms, conflicts in such
a market sometimes lead to fierce competitive struggle.
In practice, firms strive to reach agreement on prices,
division of the market, and joint use of distribution
channels for selling their products. As a result, the
group of oligopolistic firms effectively acts as a pure
monopoly, although formally they are not subject to the
state's antitrust sanctions.
The experience of market economies shows that over time
oligopolistic markets come to settle either into intense
competition (non-cooperative strategic behavior), or into
conscious parallelism (cooperative strategic behavior).
“In order to achieve the same profit as a monopolist,
producers in a situation of oligopoly must reconcile the
natural drive toward mutual competition…”.
The choice made by firms under monopoly. The general principles of profit maximization for firms
operating in a monopoly market are the same as for firms
operating in a monopolistically competitive market.
Monopolist firms are constrained by the actions of
consumers. A monopolist can set either the price or the
volume of output, but not both at the same time.
Fearing the appearance of competitors and substitute
goods on the market, a monopolist is forced to stimulate
the development of basic technologies, both to minimize
costs and to develop new, more advanced products.
Moreover, economies of scale in production may, from the
standpoint of economic efficiency, outweigh the desirability
of creating conditions for competition.
Often, instead of setting a price at a level that allows it
to earn maximum profit over a short-term interval, a
monopolist may set a somewhat lower price. In such a situation profit will be moderate in size, but the market will then become less attractive to potential competitors.
The dominant economic characteristics of the industry include:
Firms try to influence industry structure in order to gain
competitive advantages, and they begin their actions with an
analysis of the structure of the industry in which they operate.
In any industry, whether national or international in scale,
whether producing goods or providing services, the rules of
competition come down to five driving competitive forces:
the entry of new competitors into the market, the threat from
substitutes, the bargaining power of buyers, the bargaining
power of suppliers, and rivalry among firms already competing
in the market. A strategy capable of changing industry
structure is a “double-edged sword”: by applying a given
strategy, a firm can affect the profitability and structure
of the industry both positively and negatively. For example,
a newly developed product that lowers barriers to market
entry or drives the intensity of competitive rivalry to a
critical point may undermine the industry's long-term
profitability, even though the company that brought this
product to market will earn a fairly high profit for a certain
time. In another case, a prolonged period of underpriced goods may have a negative effect on differentiation. It is worthwhile to compile a "portrait" of the industry by characteristics and then to analyze it. To this end, Table 2 below presents data on the strategic importance of individual economic characteristics.
Main driving forces causing changes in the industry:
Table 2
The strategic importance of key economic characteristics of the industry
|
Characteristic |
Strategic significance |
|
Market size |
Small markets do not tend to attract large/new competitors; large ones often attract the interest of corporations wishing to acquire companies in order to strengthen their competitive position in attractive industries |
|
Growth in market size |
Rapid growth invites new entrants; a slowdown in growth increases rivalry and weeds out weak competitors |
|
Surplus or shortage of production capacity |
A surplus raises costs and lowers the level of profit; a shortage leads to the opposite tendency in costs |
|
Profitability in the industry |
Highly profitable industries attract new entrants; depressed conditions encourage exit |
|
Entry/exit barriers |
High barriers protect the positions and profits of existing firms; low barriers make them vulnerable to the entry of new ones |
|
The product is expensive for buyers |
Most buyers will buy at the lowest price |
|
Standardized products |
Buyers can easily switch from one seller to another |
|
Rapid changes in technology |
Risk increases: investment in technology and equipment may fail to pay off owing to the obsolescence of the latter |
|
Capital requirements |
Large requirements make investment decisions critical, the timing of investment becomes important, and barriers to entry and exit increase |
| Vertical integration | Capital requirements increase, and competitive differentiation and cost differentiation between firms of varying degrees of integration often grow |
| Economies of scale | Increases the volume and market size needed for price competition |
| Rapid product renewal | Shortening of the product life cycle, increased risk owing to the possibility of "product leapfrogging" |
M. Porter's model reflects the action of the five forces that determine the essence of competitive rivalry in a given industry (Fig. 2). If the action of the five forces in the market is sufficiently strong, one can assume that the level of profit in this industry will be relatively low. Otherwise, it will be high.
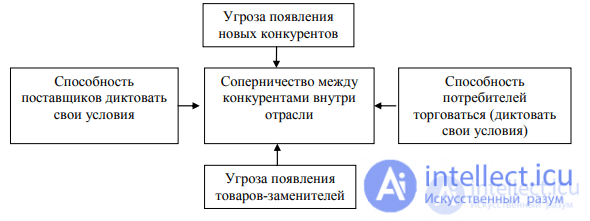
Fig. 2. Porter's five forces model of competition
Firms are able to influence each of the five forces through
their own strategy. The attractiveness of an industry can have a
much greater bearing on a firm's success than the quality of its
management. If demand significantly exceeds supply, and access
to the market is limited, even with quite average management a
firm is able to achieve a high level of profit.
This is, in a sense, a "snapshot" of the market (industry) at a
given moment. Therefore, an element of dynamics needs to be
introduced into the analysis. One of these characteristics is the concept of the industry life cycle. The life cycle
The industry life cycle comprises four stages: introduction,
growth, maturity, and decline. The stage of industry
development determines the character of competitive rivalry.
The combined action of the five forces determines a company's
ability to earn, on average, a return on invested capital
exceeding the cost of capital. The combined strength of
these five forces varies depending on the type of industry
and can change as it develops. As a result, different
types of industries are far from equal in terms of their
potential level of profitability. If in some industry the
action of competitive forces favors the companies operating
in the market, most competing companies earn a high profit.
But in those industries where one of the forces acts too
intensely, very few firms can count on high profits, no
matter how hard management tries.
The risk of entry by potential competitors (Porter's first
force) creates a danger to a company's profitability. On
the other hand, if this risk from substitute products is
small, the company can raise its price and increase revenue.
The competitive strength of this factor depends heavily on
the height of entry barriers (the cost of entering the
industry). There are three main sources of such barriers:
- brand loyalty among buyers (entering companies must offset this with substantial investment); - an absolute cost advantage (lower production costs give companies significant advantages that are difficult for new companies to acquire);
- economies of scale (this advantage is associated with large companies), linked to lower costs from mass production of standardized products, discounts on large purchases of raw materials, supplies, and components, and lower unit spending on advertising, and so on.
All of this creates significant difficulties for companies starting up production.
The structure of industry competition depends on the degree
of consolidation in the industry (whether it is fragmented, or
whether conditions of oligopoly or monopoly exist). A
fragmented industry presents potentially more threats than
favorable opportunities, since entry into such industries is
comparatively easy.
In consolidated industries, companies are, as a rule, large and
independent. Thus, the competitive actions of one company
directly affect the market share of its competitors, provoking
retaliatory actions from them and setting off a spiral of
competition. Such companies' ability to wage a price war
represents the main competitive threat. In this case companies strive to compete on qualitative distinguishing advantages, i.e., the competitive war is waged from a position of brand loyalty and minimizing the likelihood of a price war. The success of such a tactic depends on the possibilities for product differentiation in the industry.
Growth in industry demand leads to moderate competition while
providing greater opportunities for expansion. Demand grows along with
market, companies can increase the speed of return on
investment, which makes the company more attractive.
Conversely, a decline in growth causes greater competition,
as companies can only take away markets from other companies.
Thus, a decrease in demand is the main danger for
intensifying competition.
Many firms seek to enter a new industry as long as demand significantly exceeds supply, there is little rivalry, and there are no clear rules of the game, and so on.
When an industry moves into the maturity stage, firms begin
to understand and accept certain rules, taking into account
customers' wishes regarding product quality; standards
become established in the industry; rivalry becomes sharper,
since rapid growth can now be achieved only by taking
business away from other producers; accumulated experience
no longer brings advantages, since all firms have already
made use of all the possibilities; products become
increasingly homogeneous, and attempts at innovation are quickly copied. A shift to price competition becomes possible.
In declining industries, only the most professionally
experienced firms can achieve a certain level of profit.
If exit barriers are high and unprofitable firms remain in
the market, the degree of rivalry increases and all this
leads to chronic underutilization of production capacity
(excess capacity).
A change in one of the five forces can affect the others. As
a rule, the profitability of each industry is determined by
only one or two forces. When choosing a strategy, firms try
to take this into account. Forecasting of changes is necessary.
One method is to examine trends in changes in the surrounding environment, that is, the political, economic, social, and technological "environment".
Typical problems
1. The dependence of total cost on the firm's output in a monopolistically competitive market is described by the formula:

Residual demand for the firm's product is described by the formula: P = 15 – q.
Is the profit-maximizing seller in a state of short-run or long-run equilibrium?
2. A firm selling toothpaste “A” seeks to determine the optimal advertising strategy. In October the firm raised
the price of a tube of paste from 19 to 20 rubles. As a result, sales volume fell from 25 to 22 thousand tubes a week. In November the firm increased its advertising spending by
10% compared with October. As a result, sales volume increased from 22 to 22.5 thousand tubes a week. Determine the optimal share of
advertising spending in the firm's revenue.
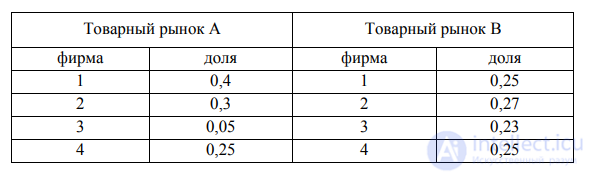
3. Table 3 presents data on the sales shares of four firms in product markets A and B. Calculate all possible concentration indices.
Table 3
Data on sales shares

Comments