Lecture
The differential distribution function W (X) of a random variable X is called the limit of a change in the probability of a random variable appearing on the interval X + АХ when there is an infinitesimal change in this interval AH:

where P (X + AX) is the probability of the occurrence of a random variable value in the interval X + AX, AH is an infinitely small change in X.

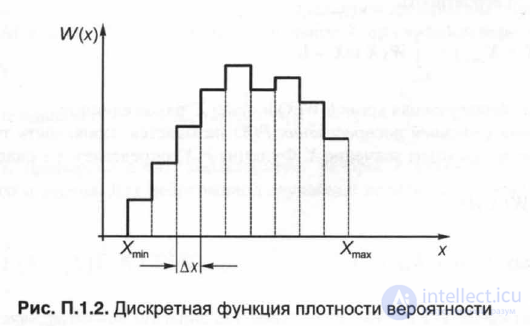
The value of W (X) is also called the distribution density or probability density. If X takes discrete values (and in practice this is almost always the case, since the device measures a random value X only at certain points in time with a certain step AH), then the probability density is a discrete function (Fig. P. 1.2).

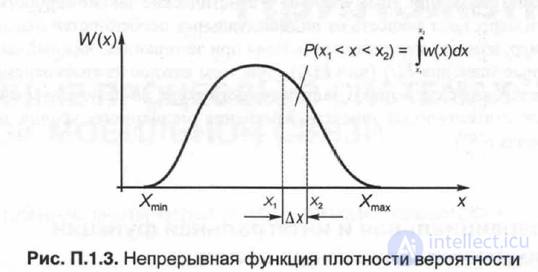
With a continuous value of X, the function W (X) is determined by the formula (P. 1.1) and is also continuous (Fig. P. 1.3). When determining W (X) from experimental results, this function is almost always discrete, since the values of the random variable X
9-632
Such a discrete function W (X), constructed on the basis of measurement data, is called a histogram (Fig. P. 1.2). With a correctly set experiment and careful processing of measurement results, the discreteness of the values of W (X) is much less than its changes, therefore at small AX (step size X) with a good approximation, W (X) can be considered a continuous function. With continuous W (X), the probability P (Xx
* 2
P (Xr Graphically, this is shown in Fig. P. 1.3 selected area.
If the physically possible values of a discrete quantity X are in the interval from XT] n to XTx, then the probability:
Htah
P {XmiB * min
that is, the area bounded by the W (X) curve and the X axis is one.
The integral distribution function P (X) is the probability that a random variable does not exceed the value X. The function P (X) is defined as:

Comments
To leave a comment
GSM Basics
Terms: GSM Basics