Lecture
A numerical function with a domain D is a correspondence, whereby each number x in the set D is assigned, according to some rule, a single number y depending on x.
Notation: y = f (x) The
independent variable x is the argument of the function f.
The number y corresponding to x is the value of the function f at the point x.
Function graph
The graph of the function f is the set of all points (x; y) of the coordinate plane, where y = f (x), and x "runs through" the entire domain of definition of the function f.
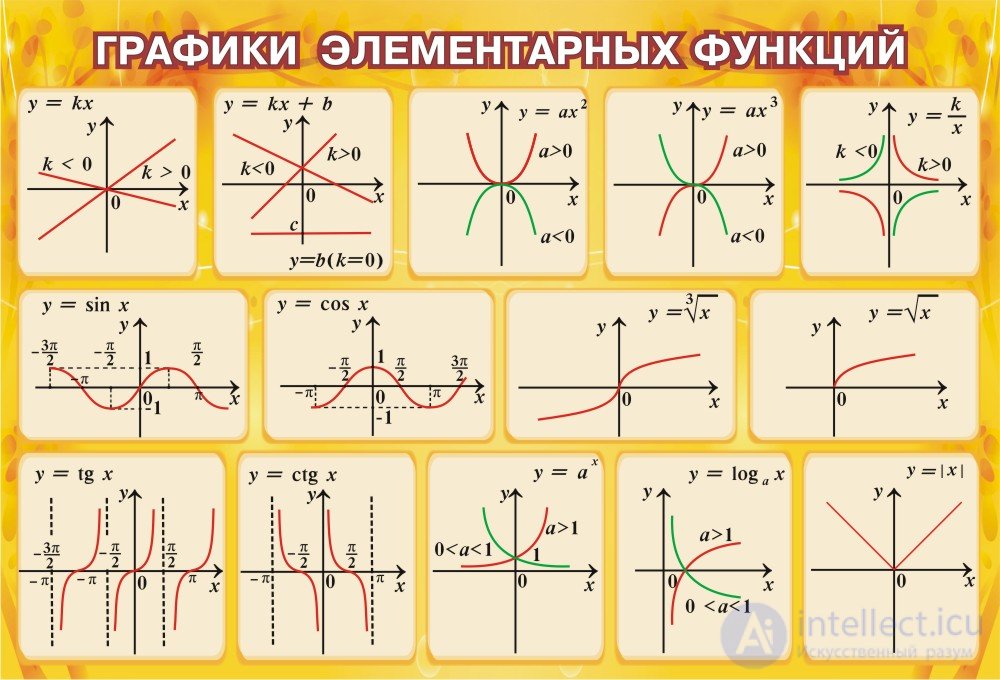
Graphs of elementary functions
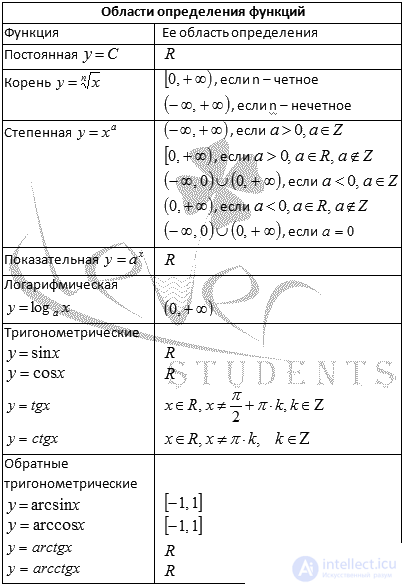
Function Definition Area
The domain of the function is the set of values of x for which the actions specified in rule f are performed.
Denoted by OOF or D (f).
From the geometrical point of view, the OOF is the projection of the graph of this function on the OX axis.
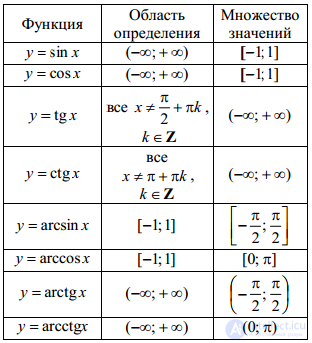
Function value area
The domain of a function is the set of values of the function f (x), which it takes when changing x on the PLA.
Denoted by OZF or E (f).
From the geometrical point of view, the OZF is a projection of the graph on the OY axis.
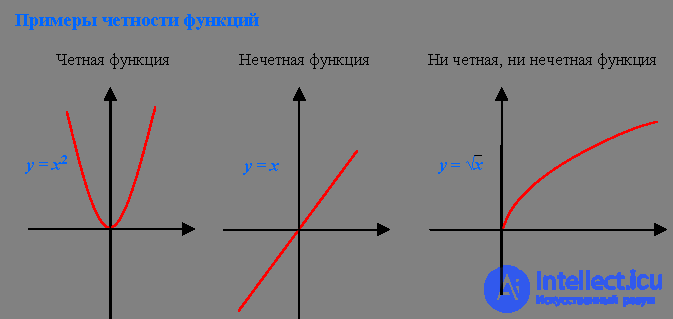
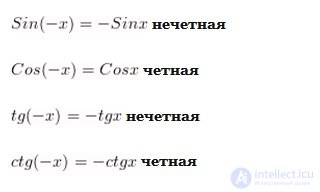
Parity and oddness of functions
The function f is called even if for any x from the OOF
f (-x) = f (x) The
graph of the even function is symmetric about the axis OY.
A function f is called odd if, for any x from the OOF, f (-x) = - f (x)
The graph of the odd function is symmetric about the origin.
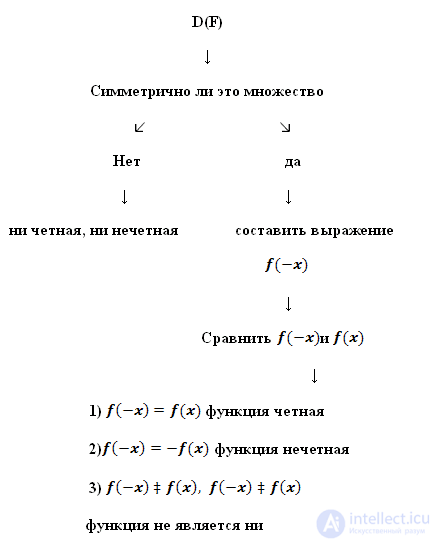
Algorithm for determining the parity of a single variable function
Frequency of functions
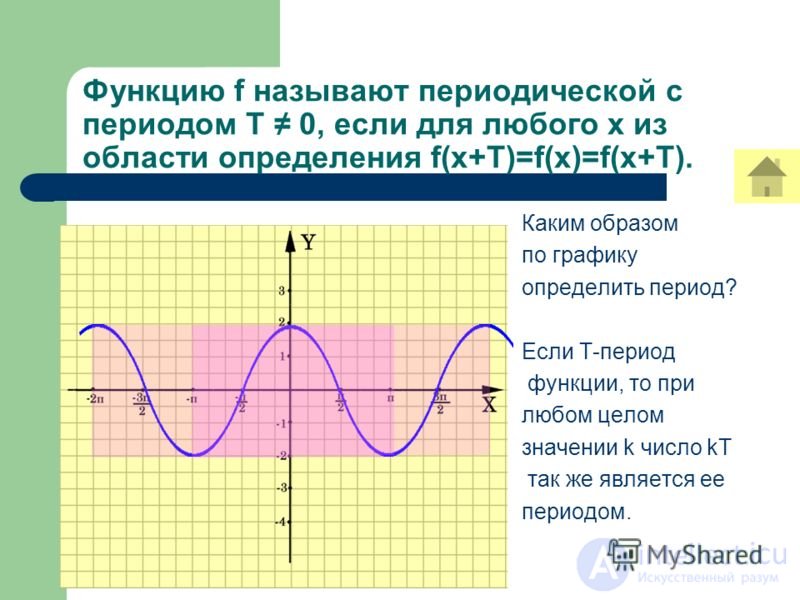
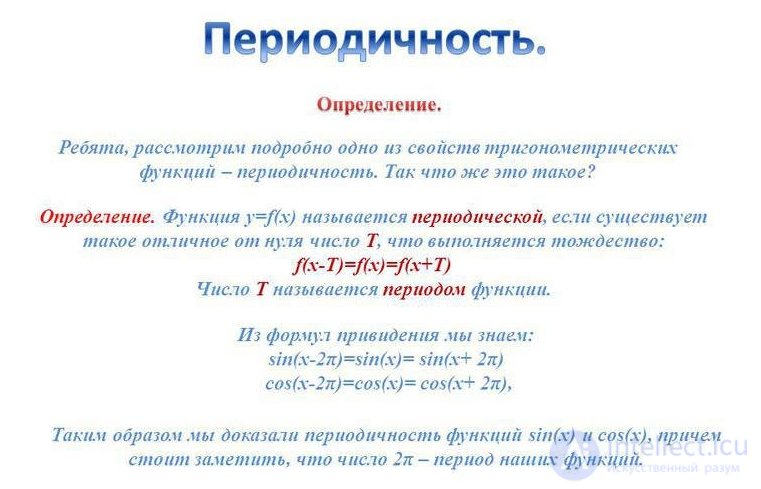
A function is called periodic with a period T ≠ 0 if for any x from an OOF,
f (x + T) = f (x) = f (x - T).
To plot the periodicity of a function with a period T, it suffices to plot on a segment of length T and transfer the resulting graph in parallel to the distance nT to the right and left along the axis OX (n is any natural number).
Increase, decrease of functions
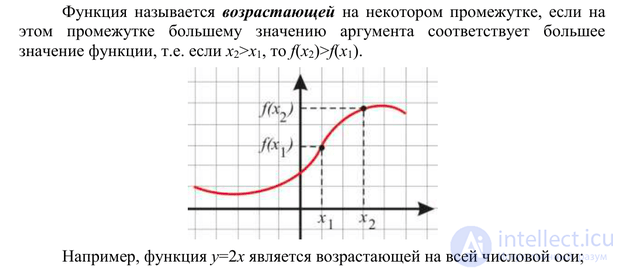
The function f grows on the set P if, for any x1 and x2 from the set P, such that x2> x1, the inequality f (x2)> f (x1) holds.
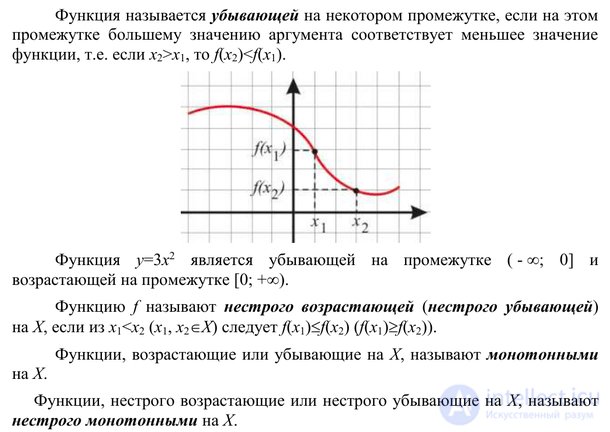
The function f decreases on the set P if, for any x1 and x2 from the set P, such that x2> x1, the inequality f (x2)
Conversion function graphs
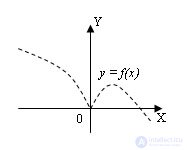
Let the graph of the function y = f (x) be given .
Then:
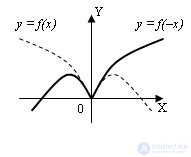
1. The graph of the function y = f (–x) is obtained by a symmetric display of the graph y = f (x) about the axis OY:
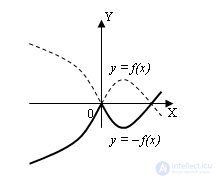
2. The graph of the function y = –f (x) is obtained by a symmetric display of the graph y = f (x) about the axis OX:
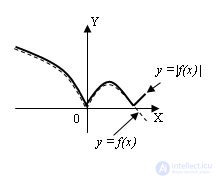
3. Graph of the function y = | f (x) | is obtained as follows: we circle that part of the graph of the function y = f (x), which lies above the axis OX, and the part below which is displayed symmetrically with the axis OX:
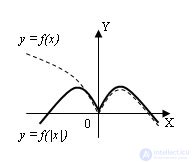
4. The graph of the function y = f (| x |) is obtained as follows: we discard the part of the graph of the function y = f (x) lying to the left of the OY axis, circle the portion of the graph of the function y = f (x) that lies to the right of the OY axis and display it symmetric to the OY axis:
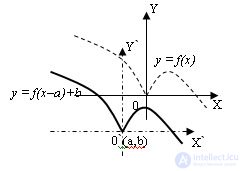
5. The graph of the function y = f (x – a) + b is obtained by plotting the function y = f (x) in the new coordinate system X`0`Y`, where 0` (a, b), 0`X` || 0x, 0`Y` || 0Y:
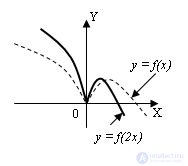
6. The graph of the function y = f (m * x), m> 0, is obtained from this 1 / m time stretch (if m <0) from the OY axis (along the OX axis) and being compressed m times (m> 1) to the axis OY:
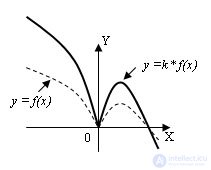
7. The graph of the function y = k * f (x), k> 0, is obtained from the given tension by a factor of k (k> 1) relative to the axis OX (along the axis OY) and compression by 1 / k times (for k <1) to the axis OX:
Comments
To leave a comment
HANDBOOK ON MATHEMATICS, SCHOOL MATHEMATICS, HIGHER MATHEMATICS
Terms: HANDBOOK ON MATHEMATICS, SCHOOL MATHEMATICS, HIGHER MATHEMATICS