
Lecture
«Ecological footprint» (ecological footprint) — an indicator of pressure on nature.
Any type of human activity uses biologically productive land and/or fishing zones. The «ecological footprint» (EF) indicator measures a population's consumption of food and materials in equivalents of the area of biologically productive land and sea area required to produce these resources and absorb the resulting waste, while energy consumption is measured in equivalents of the area required to absorb the corresponding CO2 emissions.
Carbon footprint (English: carbon footprint) — the total set of all greenhouse gas emissions produced directly and indirectly by an individual, organization, event, or product . Greenhouse gases, including carbon dioxide (CO2) and methane (CH4), can be emitted during land clearing, the production and consumption of food, fuel, the manufacture and use of industrial goods, materials, timber, roads, buildings, transport, and various services .
Most of the carbon footprint of residents of developed countries arises from «indirect» sources, for example, the burning of fuel to manufacture and deliver a product to the end consumer. These emissions differ from directly burning fuel in a car or on a stove, which are usually called «direct» sources of a person's carbon footprint . In most cases the total carbon footprint cannot be precisely calculated due to a lack of knowledge and information about the complex interactions between the processes affecting it, including natural processes that accumulate or release carbon dioxide. For this reason, Wright, Kemp, and Williams proposed the following definition of carbon footprint:
The total amount of carbon dioxide (CO2) and methane (CH4) emissions caused by a given population or activity, taking into account all relevant sources, sinks, and storage within the spatial and temporal boundaries of that population or activity. Calculated as a carbon dioxide equivalent, using the relevant 100-year global warming potential .
Reducing the carbon footprint is one of the most important tasks of our time, the solution of which will bring us closer to an acceptable level of anthropogenic impact on the biosphere and help mitigate the effects of climate change
The original concept of the «Carbon footprint» derives from the concept of the «Ecological footprint», developed in the 1990s by William E. Rees[en] and Mathis Wackernagel[en][10]. Unlike the ecological footprint, which is calculated based on how many resources per capita the planet can renew, the carbon footprint merely indicates the volume of emissions in CO2 equivalent, thereby being a component part of a more comprehensive concept[11]. However, the notion of a carbon footprint is more illustrative, as it shows clear statistics.
The term «carbon footprint» was brought from scientific discourse into public discussion in 2005 by marketers at the advertising agency «Ogilvy»[10] during a massive advertising campaign conducted on commission from British Petroleum in order to minimize the reputational damage suffered by the company and the industry as a result of a series of environmental disasters at the company's facilities in the early 2000s. The goal of the campaign was to divert public attention away from the oil and gas industry and toward the «personal responsibility» of ordinary consumers. During the campaign people were encouraged to calculate their carbon footprints and «go on a low-carbon diet»[12]. Other corporations specializing in fossil fuel extraction follow similar strategies[13], although the strategy itself is not new and was borrowed from tobacco and plastics manufacturers, who likewise shifted the blame for the negative consequences of their businesses' activities onto ordinary people
As for BP itself, the company made no attempts to reduce its own carbon footprint, and moreover, it is still increasing oil production to this day[18][19], although it cannot be denied that the advertising did indeed influence ordinary people to pay closer attention to the genuinely important problem of the carbon footprint[20].
Various online calculators exist for calculating a personal carbon footprint. On their websites you need to answer several questions about diet, home size, purchases and leisure, and the use of transport, electricity, and heating[21]. Based on the answers, the website calculates an approximate carbon footprint. These results are primarily indicative; they can help identify the most problematic sources of greenhouse gas emissions in a household. For example, just one round-trip flight across the Atlantic adds 1.6 tons of CO2 equivalent to the carbon footprint, and a full year of using a car adds, on average, 2.4 tons. Using LED bulbs will save approximately 0.1 tons of CO2 equivalent per year and reduce electricity bills
One way to reduce your carbon footprint is to use a personal car less and replace driving with walking or cycling; if that is not possible, it is worth using public transport[24].
Dietary choices have a major impact on the carbon footprint. It is increased most strongly by red meat and by products transported over long distances (especially by air).
In July 2017 a study was published indicating that the most effective way to reduce one's personal carbon footprint is to have fewer children. Each child increases a family's carbon footprint by 58.6 tons of CO2 equivalent
Calculating the carbon footprint of an industry, product, or service is a complex task. The International Organization for Standardization has the ISO 14040:2006 standard, on the basis of which the Life Cycle Assessment[en] standard was created, allowing an approximate assessment of the environmental consequences of producing a product or service, including their carbon footprint.
Maritime shipping is among the world leaders in environmental pollution and harmful emissions: global maritime transport ranks 6th in the world in terms of equivalent greenhouse gas emissions; maritime shipping accounts for about 2.5% of the annual global volume of greenhouse gas emissions, and maritime transport emits about 940 million tons of carbon dioxide per year
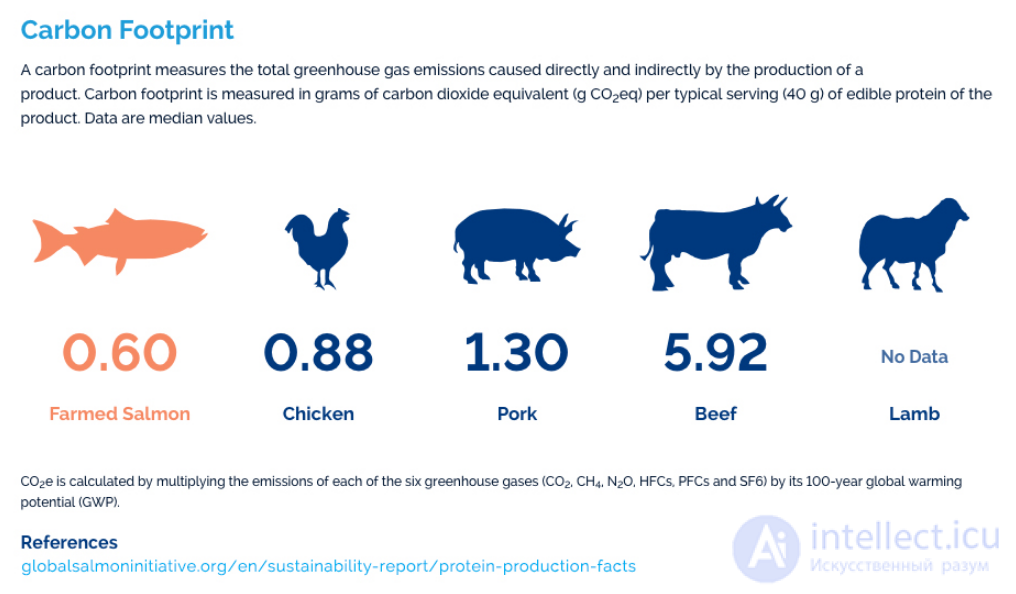
A slide comparing the carbon footprint emissions from animal meat and salmon, from the Sustainability Report[27] of the «Global Salmon Initiative» (Global Salmon Initiative)
The carbon footprint of production can be reduced, for example, by insulating buildings, installing solar panels on roofs, using energy from renewable sources, and making technological improvements (more efficient bulbs and equipment)[30].
Reducing the carbon footprint can also depend on the materials used for production or packaging. For example, using and manufacturing plastic containers and packaging instead of glass or metal can potentially reduce the CO2 footprint released. Thus, Franklin Associates calculated hydrocarbon emissions from the production of various types of bottles per 2,957 liters of beverage. According to the report's data, the production of plastic bottles showed the lowest CO2 emission results at all stages of the life cycle. And plastic components in cars and airplanes help reduce the weight of the vehicle, which subsequently affects fuel consumption efficiency and leads to a reduction in hydrocarbon emissions into the atmosphere. Moreover, the production of a paper bag, which is considered more environmentally friendly, results in 70% higher greenhouse gas emissions than the production of the same bag made of plastic[31].
The Paris Agreement was adopted under the UN Framework Convention on Climate Change and ratified by more than 110 states. It entered into force on November 4, 2016, and is the main document that will regulate issues of global climate change after 2020[32][33].
This agreement testifies to the achievement of a compromise between political and socio-economic interests with the goal of developing international cooperation to reduce risks associated with climate change. Ratification of this document testifies not only to a commitment to the principles laid down in the UN Framework Convention on Climate Change (UNFCCC), but also to an awareness of the need to take decisive measures to adapt to the consequences of these changes, as well as to reduce the anthropogenic burden on the global climate by keeping the concentration of greenhouse gases in the atmosphere at a level that does not allow the average temperature on the planet to rise above 2°C[34
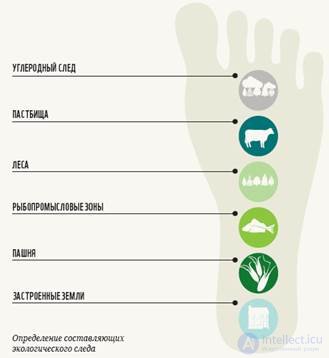
The ecological footprint per person represents the sum of six components:
The ecological footprint represents the sum of all these areas, regardless of exactly where on the planet they are located.
The ecological footprint is the area of biologically productive land and water surface required to produce the resources consumed by a person and to absorb waste. The main type of waste accounted for by the System of National Ecological Accounts is carbon dioxide generated by burning fossil fuels. The value of the ecological footprint is expressed in universal standardized units of measurement — global hectares (gha). A global hectare is a conventional unit denoting a hectare of biologically productive land or water area with the world average bioproductivity for a given year.
The ecological footprint is calculated by the Global Footprint Network (GFN) — an international research institute with branches in North America, Europe, and Asia. In a number of countries, including Russia, this work is carried out jointly with WWF. The set of methods developed by GFN allows countries (as well as regions, cities, and even individual households) to measure their level of consumption of natural capital and compare it with the volume of available renewable resource reserves.
The everyday life of people is the main source of the ecological footprint. Almost 70% (68%, to be precise) of the footprint is the result of household consumption. Socio-economic factors, income levels, food products, consumed goods and services, and the waste generated — all of this becomes part of a country's ecological footprint.
The «ecological footprint» and the ecological capacity of a territory are measured in «global» hectares per capita. A «global» hectare («global hectare») – is 1 hectare of biologically productive land with the world average level of productivity.
Significance: The EF method allows comparison of society's actual pressure on nature with what is possible from the standpoint of potential natural resource reserves and assimilation processes. The «ecological footprint» can be compared with the amount of ecologically productive land in a given region, and the result of this comparison serves as an indicator of the region's progress toward sustainable development.
The value of the «ecological footprint» for the countries of the world is calculated annually by the Global Footprint Network. Humanity consumes the services that nature provides too intensively – faster than the natural potential for their production manages to be restored. Already, humanity's total footprint exceeds the biosphere's capacity by 30%. The ecological footprint of the average consumer from developed countries of the world is 4 times greater than the corresponding figure for a consumer from countries with low per capita incomes. In 2005, the global ecological footprint amounted to 17.5 billion global hectares (gha), or 2.7 gha per person. At the same time, the total area of the planet's productive land and water surfaces, or biocapacity, amounted to 13.6 billion gha. The planet can provide only 1.9 gha per person.
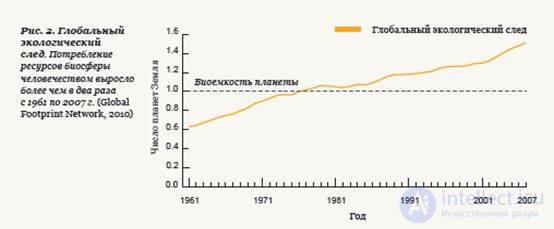
The number of planets that will be needed by 2030 at current levels of production and consumption is 2.
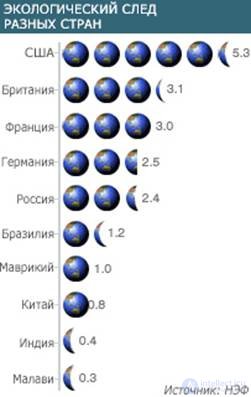 The United States and China leave the largest ecological footprints. Residents of the US use on average 9.4 gha (or almost four and a half Planet Earths, if the entire world population had the same consumption pattern), while residents of China use 2.1 gha per person (one Planet Earth). The average European uses 6.3 gha, and the average Indian uses 0.8 gha.
Eight countries — the USA, Brazil, Russia, China, India, Canada, Argentina, and Australia — own more than half of the Earth's entire biological potential. Population and consumption patterns make three of these countries ecological debtors, meaning their ecological footprint is greater than these countries' biological potential — these are the USA and two fast-growing economies: China and India.
One of the scarcest resources on Earth (50% of countries are already experiencing a shortage of it) is water. An enormous amount of water is sold in the form of goods and products. For example, producing a single cotton T-shirt requires 2,900 liters of water. On average, each person consumes and uses 1.2 million liters (about half an Olympic swimming pool) of water per year. At the same time, a resident of the US uses about 2.5 million liters per year, while a resident of arid Yemen uses only 619 thousand liters. Overall, in African countries the per capita ecological footprint has decreased by 19% compared to 1961, even though the population has tripled. Wealthy countries have left 76% more of a «footprint» over the same period. Greenhouse gas emissions alone in the wealthiest states have grown 9-fold.
Russia belongs to the group of middle-income countries; in such countries the population tends to decrease, while the footprint also grows. For Russia, it has increased by 21% since 1961. Today Russia's footprint amounts to 3.7 gha per person, which is almost three times smaller than the US footprint, but larger than, for example, Ukraine's, which uses 2.7 gha per person.

Comments