Content
Introduction
Formulation of the problem
Recurrence ratio for spectral reading
Filter for calculating the spectrum of a given harmonic
Selecting a set of fixed harmonics from the signal spectrum
Selection of amplitudes of multiple harmonics with nonlinear distortion of the signal
findings
Introduction
In this article, we will look at the rather specific task of analyzing a change in a given spectral reference over time. Such a problem is relevant when decoding a DTMF signal or when monitoring a given set of multiple harmonics in time, when the use of FFT algorithms is impractical due to the small number of spectral samples.
Formulation of the problem
Let us say a few words about the notation that will be used in this article. The samples of the original discrete signal (in the general case complex) will be denoted by small

,

- reference number. Spectral signal counts
we will denote by capital letter

,

- number of spectral counting corresponding to frequency

,

- sampling frequency,

- the number of points of the DFT.
Figure 1 shows a three-dimensional picture. On the vertical axis, we have the values of the signal spectrum
- number of the spectral reference. Over time, we get more and more new samples and spectrum
is changing. So in Figure 1 blue shows the change in the spectrum
for three time slices corresponding to the signal sample numbers
.
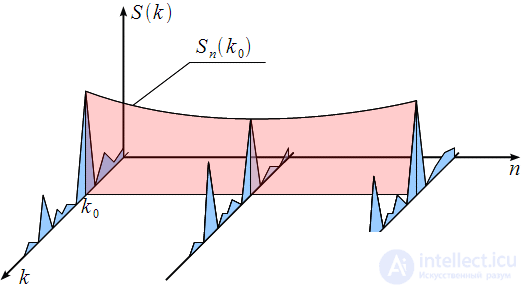
Figure 1: Three-dimensional representation of a time-varying signal spectrum
Then for some specific spectral reading

we can get a frequency cut

(shown in red) from which we can analyze the amplitude and phase of the spectral reading
in time. In this article we will deal with the analysis of changes in a given spectral sample in time when new signal samples are received.
For DTMF decoding, the Goertzel algorithm, which allowed us to calculate a given spectral count using the recurrence relation, which we represented as an IIR filter, became widespread. But we said that when using the Goertzel algorithm, we were not interested in all intermediate results of the recurrence formula, therefore we could not get the value of the spectral count more than every
counts. We will consider an algorithm that allows for spectrum recalculation “on the fly,” that is, upon receipt of each successive reference. We will see that the resulting algorithm will be a modification of the Goertzel algorithm for recalculating the spectral count at each sampling clock.
Consider the discrete Fourier transform (DFT), which is given by the expression:
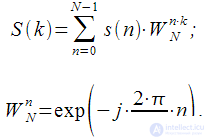 |
(one) |
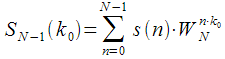
To calculate the DFT value for one fixed spectral reference (one harmonic) with the number
DFT expression takes the form
 |
(2) |
Calculations of one fixed harmonic with a number
can be done using the structure shown in Figure 2. In essence (2) this is the output of an FIR filter.

Figure 2: Fixed harmonic calculation
Thus, to calculate a single spectral reference, it is required
complex multiplications and additions.
Let the input samples
enter the buffer length
and with each new reference
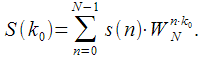
it is necessary to recalculate the value of the fixed harmonic as shown in Fig. 3. In other words, when the next sample arrives, the buffer is shifted and the output of the FIR filter changes.
Figure 3: Recalculation of the fixed harmonics for the sampling interval
Figure 3 shows harmonic values.

on the previous clock cycle, i.e. when a reference signal arrives

:
 |
(3) |
and

on the current clock when the original signal is received

.
For the sampling interval must be performed
complex multiplications and additions, which is impossible in real time at high sampling rates. However, from Figure 3 it can be noted that the recalculation of the entire spectral reference is extremely inefficient, since the same samples are used as in the previous cycle, except for

which is not involved in the calculation
and
which is not involved in the calculation
. Thus, it can be assumed that there is a way to recurrently recalculate the spectral count at the current and previous ticks.
Recurrence ratio for spectral reading
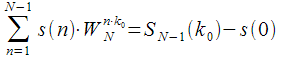
Consider more carefully the calculation
. Figure 4 shows that upon receipt of the next reference
(shown in green), the buffer is shifted and the countdown
(marked in yellow) goes out of the buffer, or it can be said that it goes beyond the impulse response of the FIR filter.
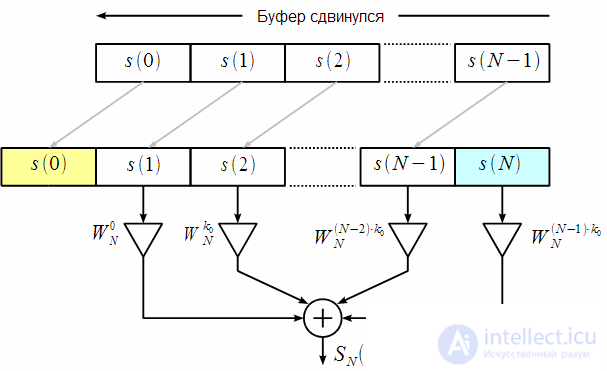
Figure 4: Buffer shift on the next cycle
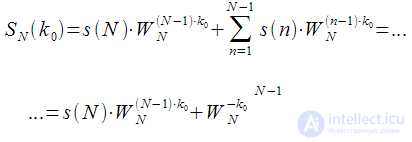
Then the expression for calculating the harmonics at the next cycle can be written:
 |
(four) |
Note that
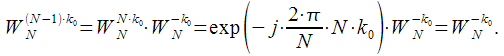 |
(five) |
In addition, from expression (3), it can be noted that
 |
(6) |
Then you can finally write down:
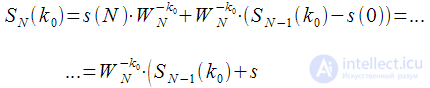 |
(7) |
Expression (7) is nothing more than a recurrence relation that relates the value of the DFT of one harmonic for the previous and next clock cycle. Recalculation of the previous clock to the next requires only one complex multiplication and two complex additions, which can be implemented in real time. It is very important that the complexity of the recalculation of the spectral reference does not depend on
- always one complex multiplication and two additions.
Filter for calculating the spectrum of a given harmonic
The recurrence relation (7) can be interpreted as the difference equation of the IIR filter:
 |
(eight) |
Where

- delayed by
samples input signal
(complex or real), in expression (7)
corresponds to
. The ratio (7) is obtained from (8) with

.
Thus, we have managed to move from the FIR structure to the recurrence relation of the corresponding IIR filter. The structure of an IIR filter corresponding to the difference equation (8) is shown in Figure 5.
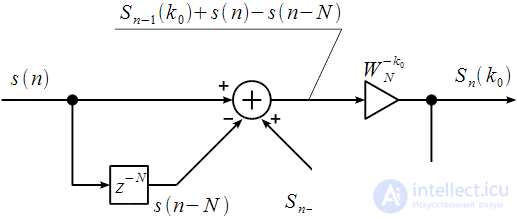
Figure 5: IIR filter for calculating the spectral count
The transfer characteristic of the resulting filter is:
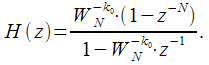 |
(9) |
All input, output filter counts, as well as coefficient

are complex.
Note that (9) is very similar to the transfer characteristic.

IIR - the filter corresponding to the algorithm of Goetzel:
 |
(ten) |
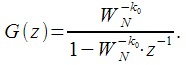
Then the resulting transfer characteristic

IIR - a filter that “can recalculate” the previous value of the spectral reference to the current one when the next sample of a discrete signal arrives, can be represented through the transfer characteristic of the IIR - filter of the Goertzel algorithm:
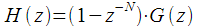 |
(eleven) |
Thus, we obtained a modification of the algorithm of Hörzel in the form of a non-recursive branch

, which allows to conduct a dynamic recalculation of the spectral sample when a signal is received in real time.
Let the complex input signal
equals:
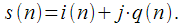 |
(12) |
The spectral counts at the filter output are:
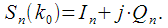 |
(13) |
The filter coefficient is:
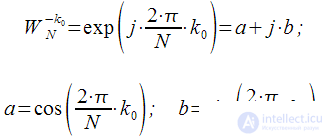 |
(14) |
Then the expression (8) can be written:
 |
(15) |
Converting (15) you can get:
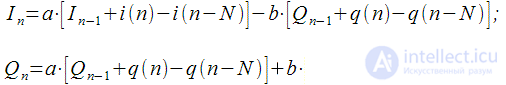 |
(sixteen) |
Then the calculation of the spectral reference can be represented by the structural scheme shown in Figure 6 using only real multiplications and additions.
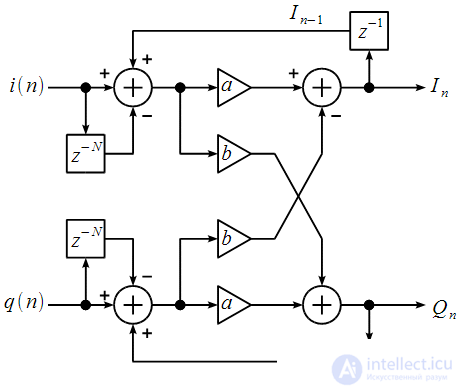
Figure 6: IIR filter for calculating the spectral count with real multiplications
Selecting a set of fixed harmonics from the signal spectrum
We will consider an example of the selection of two harmonics with frequencies

and

at sampling rate

. Consider how to choose the right number of points DFT
as well as numbers of spectral samples

and

corresponding frequencies
and
.
In order for us to distinguish these signals in the spectrum, the number of DFT points
should be such that frequency
and
“Did not merge” into one harmonic, i.e.
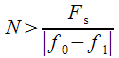 |
(17) |
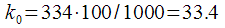
Then number
spectral count for frequency
will be equal to:
 |
(18) |
and number
spectral count for frequency
will be equal to:
 |
(nineteen) |
Let the sampling rate be
,
and
. Then the number of DFT points should be:
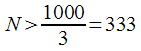 |
(20) |
Let be

then
, but
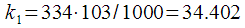
. The location of the harmonics is shown in Figure 7.
Figure 7: The location of the signal harmonics between the DFT points
As can be seen from Figure 7, the harmonics are located midway between the DFT points, which means their amplitudes will be distorted due to the spreading effect of the spectrum. To eliminate this, you need

round up then

and according to (18)

. Then at
practically coincides with the 35th number of the spectral reference, as shown in Figure 8.
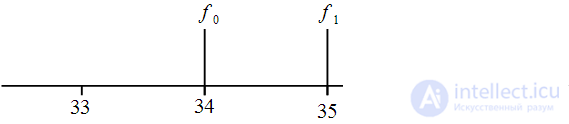
Figure 8: Buffer length selection, to reduce the spread spectrum effect
With the coincidence of the frequency of the harmonic and the frequency of the spectral reference, we obtain that the buffer length
an integer number of repetition periods of the signal falls, which will reduce the spreading effect when calculating the spectral count.
Figure 9 shows the graphs for measuring the amplitude of the harmonics.

and

when alternating signals with frequencies
and
sampling rate
and
. Frequencies
and
replace each other every second.
Figure 9: Alternating Signals with Controlled Frequencies
From Figure 9 it can be seen that when the frequencies change, a “transient process” is observed whose duration is equal to
. This must be considered when processing.
Selection of amplitudes of multiple harmonics with nonlinear distortion of the signal
In this section, we will give an example of measuring multiple harmonics using an IIR filter shown in Fig. 6. To isolate amplitudes of multiple harmonics of a non-linearly distorted signal with a frequency
.
Let the signal at the output of the nonlinear element is described by the expression:
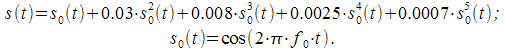 |
(21) |
Figure 10 shows the waveform.

at the output of the nonlinear element. The sampling rate is
.
Figure 10: The signal at the output of the nonlinear element
At the output of the nonlinear element, we get a set of multiple harmonics separated from each other by
.
The buffer length required to distinguish multiple harmonics is equal to:
 |
(22) |
For better discrimination, you can take a buffer length

points. Then the numbers of spectral samples corresponding to the first four harmonics
are equal:
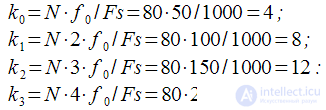 |
(23) |
All harmonics fall on the DFT points, therefore spreading of the spectrum will not be observed. Figure 11 shows the signal spectrum.
, and in figure 12, the amplitudes of the first four harmonics are estimated using the modified Goertzel algorithm.
|
Figure 11: The spectrum of the signal at the output of the nonlinear element
|
Figure 12: Dynamic tracking of amplitudes of multiple harmonics of a signal
|
Figure 12 shows that the first
points the modified algorithm completely repeats the algorithm of Goetzel, but after the buffer is completely filled, and the non-recursive branch of the IIR filter begins to work, we obtain a dynamic recalculation of the amplitudes of the harmonics at each sampling clock. This allows us to conduct continuous tracking of the amplitudes of multiple harmonics at the output of the nonlinear element. The measured amplitudes are exactly equal to the amplitudes of the harmonics shown in Figure 11, but we can observe their change over time as shown in the three-dimensional projection (Figure 1).
findings
In this article, we reviewed a modification of the Goertzel algorithm, which allows us to recalculate a given spectral sample at each discretization cycle using the recurrence relation (7). It was shown that a modification of the Goertzel algorithm consists of adding a non-recursive branch with a delay of
samples to IIR - filter of Goertzel algorithm and allows to take into account all intermediate results when calculating a given harmonic of the signal spectrum.Also shown are examples of choosing the buffer length
when analyzing two spectral components, as well as harmonics of a multiple frequency at the output of the nonlinear element.

Comments