Content
- Introduction
- Time sampling. Discrete signal spectrum
- The repetition of the signal in time. Discrete Fourier Transform
- Inverse Discrete Fourier Transform
- Indexing spectral samples. Rearrangement of spectral samples
- findings
Introduction
Often in the literature on digital signal processing, the expression for the discrete Fourier transform (DFT) is given “as a given”, and the expression for the direct and inverse DFT is not given due attention. However, an understanding of this transition will make it possible to better understand the properties of the DFT and the essence of digital spectral analysis as a whole. To begin with, we also write down the expressions for the continuous and discrete Fourier transform, and then we go to the DFT from the Fourier integral.
Time sampling. Discrete signal spectrum
So a pair of continuous Fourier transform (Fourier integral) has the form:
 |
(one) |
Where

- signal spectrum

(in general, both the signal and the spectrum are complex).
The expressions for the direct DFT and inverse discrete Fourier transform (IDFT) are:
 |
(2) |
The expression for the DFT matches

signal readings

,

, generally integrated,

spectrum readings

,

.
It can be noted that, both in the continuous and in the discrete case, there is a normalization coefficient in the expression for the inverse transformation. In the case of the Fourier integral, this

in the case of ODPP -

. It can be noted that in the case of continuous conversion, the normalization coefficient

It is designed to correctly display the scaling of the signal in time in the frequency domain and vice versa. In other words, if we sequentially calculate the spectrum of a certain signal, and then take the inverse Fourier transform, then the result of the inverse transform should completely coincide with the original signal. Normalization factor

reduces the amplitude of the signal at the output of the inverse transform so that it coincides with the amplitude of the original signal.
Consider now the signal

as a result of multiplying a continuous signal

on the lattice function
 , , |
(3) |
Where

- delta function,
 |
(four) |

- sampling interval. Graphically, the sampling process can be represented as shown in Figure 1.
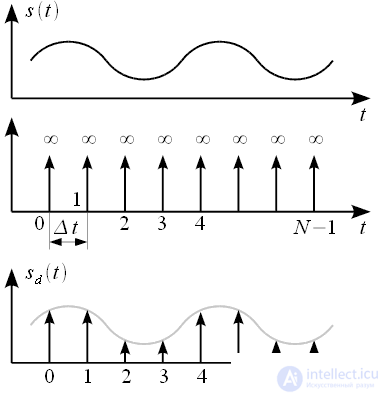
Figure 1: Signal Sampling Process
We calculate the spectrum of a discrete signal, for this we substitute the expression for the discrete signal (3) in the expression for the Fourier transform (1), we get:
 |
(five) |
Swap the operations of summation and integration and recall the filtering property of the delta function:
 . . |
(6) |
Then the expression (5) in view of (6):
 |
(7) |
Thus, we got rid of the integration in infinite limits, replacing the complex summation of the complex exponentials. But while the frequency

varies on the entire number axis. However, it can be noted that the complex exponents under the sum sign in expression (7) are periodic functions with a period:
 |
(eight) |
It should be noted that

excluded from expression (8), since

complex exponent is one for all frequencies. Thus the maximum repetition period of the spectrum

will be at

and is equal to
 . . |
(9) |
As a result, only one repetition period can be considered.

at

The repetition of the signal in time. Discrete Fourier Transform
Digital processing requires both discrete signal samples and discrete spectrum samples. It is known that the discrete (or as they say line spectrum) have periodic signals, and the line spectrum is obtained by expanding the Fourier series of a periodic signal. So, to get a discrete spectrum, you must make the original discrete signal periodic, or in other words you must repeat this signal in time an infinite number of times with a certain period

then its spectrum will contain discrete harmonics multiple

. Graphically, the process of repeating a signal in time is presented in Figure 2.

Figure 2: Signal Repeat Over Time
The original signal is shown in black, its repetition is grayed out after a certain period.

.
As follows from Figure 2, the signal can be repeated with a different period.

However, it is necessary that the repetition period be more than or equal to the duration of the signal, i.e.

. The minimum repetition period of the signal
 . . |
(ten) |
This is the minimum period at which the signal and its repetition do not overlap each other. Repetition signal with a minimum period

presented in Figure 3.

Figure 3: Minimum Period Repeat
By repeating a signal with a minimum period, we obtain a line spectrum of the signal, consisting of harmonics of multiples
 |
(eleven) |
and on one period

will get
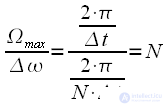 |
(12) |
spectrum harmonics.
Thus, we can discretize the spectrum of a discrete signal in one repetition period.

with step

and thereby

spectrum readings. We take into account the above in expression (7), we get:
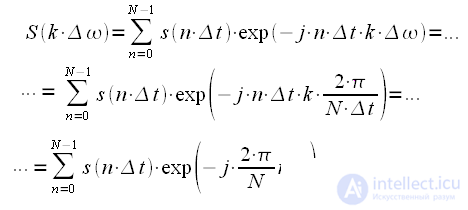 |
(13) |
If we omit in the expression (13) the discretization time step

and by frequency

then we get the final expression for the DFT:
 |
(14) |
It can be concluded that the DFT sets

discrete signal samples

samples of the discrete spectrum, while it is assumed that both the signal and the spectrum are periodic and analyzed on the same period.
Details of the DFT properties will be analyzed below. We will deal with the withdrawal of the PDPF.
Inverse Discrete Fourier Transform
Similarly to (3), we can write the expression for the discrete spectrum through the lattice function
 , , |
(15) |
Where

- discrete spectrum readings on one repetition period

. Substitute in the expression for the inverse Fourier transform (1):
 |
(sixteen) |
Where

- the coefficient of proportionality, the task of which is to ensure equality in amplitude of the original discrete signal and the result of ODPP, the coefficient of proportionality takes into account the coefficient

. Swapping the operations of summation and integration and take into account the filtering property of the delta function we get:
 |
(17) |
Take discrete samples

after interval

, then (17) can be written:
 |
(18) |
We take into account (11) and get:
 |
(nineteen) |
Omitting the frequency and time sampling intervals in expression (19), leaving only the indices, we obtain an expression for the IDFTs in which the coefficient of proportionality is unknown:
 |
(20) |
In order to calculate the coefficient

, it is necessary to substitute the expression for calculating the spectrum using the DFT (14) in the expression for IDFT (20), we get:
 |
(21) |
Swap the summation procedure in (21) and combine the exponents:
 |
(22) |
Let us consider in more detail the sum of the complex exponentials included in (22). With

we get:
 |
(23) |
Now consider the same amount when

. Let be

then we get:
 . . |
(24) |
Then each complex exponent included in the sum is a vector on the complex plane of unit length, rotated by an angle:
 , , |
(25) |
such vectors will be

and they are turned relative to each other at the same angles. Since all vectors come from one point (from 0 of the complex plane) and are rotated relative to each other at the same angles, their sum is equal to zero. This is illustrated visually for

in Figure 4.
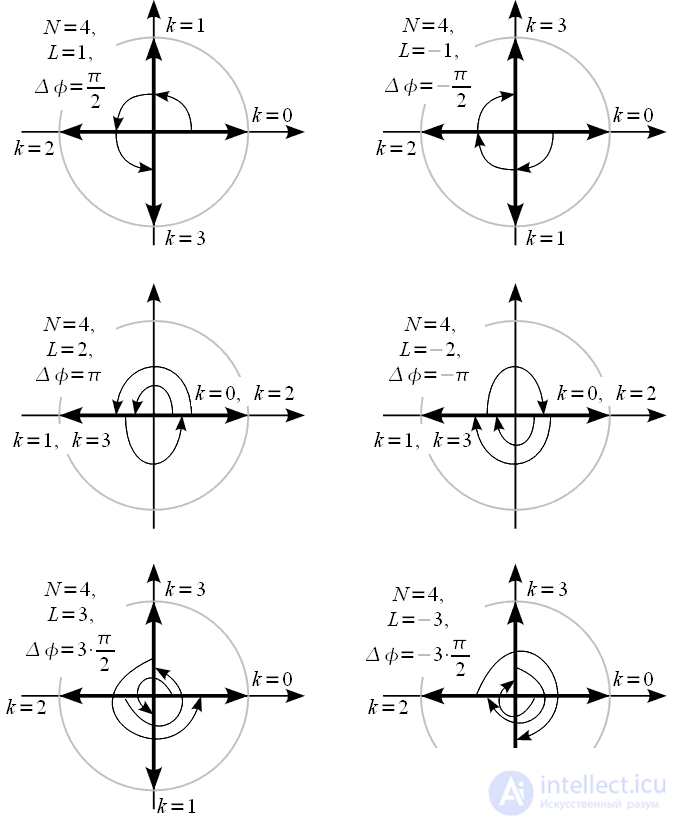
Figure 4: Sum of complex exhibitors
From Figure 4, it is indeed possible to conclude that for all

,

,

,

, sums of complex exponentials (24) are really zero. Then in expression (22) of the amount of

will only add to

. Then you can write (22):
 |
(26) |
From (26) we can conclude that

. Thus, the expression for IDFT can be finally written down:
 |
(27) |
Indexing spectral samples. Rearrangement of spectral samples
Thus, we obtained expressions for both the direct and inverse DFTs. We make a few comments.
Remark 1. The DFT and ODPF are calculated on the basis of time indices.

and spectral

counts without taking into account the sampling frequency. This allows the use of expressions for the DFT and IDFT at any sampling rate without changing the computational program. This is a definite plus of the DFT, and if you need to link the indices to the sampling frequency (to the real frequency axis), then you need to remember that the frequency spectrum was sampled in increments

rad / c, or

Hz where

,

- sampling rate in Hz. Thus, if the sampling rate is known, then

- th spectral count corresponds to frequency

happy / c or

Hz For example, at the sampling rate

kHz with

,

spectral count corresponds to the frequency

kHz
Remark 2. The discretization of the spectrum in the DFT was carried out on one period of the repetition of the spectrum.

. Moreover, due to the periodicity of the spectrum of a discrete signal, the samples

at

correspond to both frequencies

and frequencies

where

, i.e

at

correspond to negative frequencies

i.e. physically at

the second half of the spectrum is the frequencies from -

. This is vividly illustrated by figure 5. In order from the spectrum in the frequency range

calculated using the discrete Fourier transform, obtain the spectrum of the signal in the interval

it is necessary to swap the two halves of the spectral samples (see figure 5).
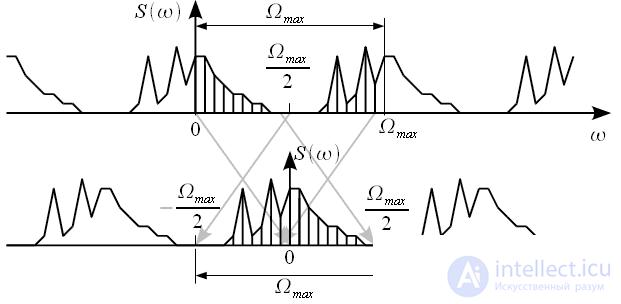
Figure 5: Rearranging Spectral Samples
Note 3. If the original signal is valid, i.e.

for

then
 |
(28) |
Zero spectrum report is a constant component of the signal. If a

- even, then
 |
(29) |
The central spectral reading also has no imaginary part.
 |
(thirty) |
Consider that

, then we can conclude:

,

that is, the second half of the spectral samples is complexly coupled with the first. Figure 6 shows a view of the real and imaginary parts of the complex spectrum of the real signal with an even

. Red marked pure real

and

.
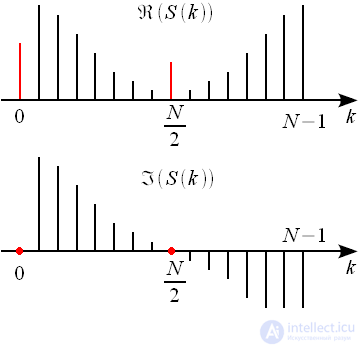
Figure 6: Real and imaginary parts of the complex spectrum of a valid signal with an even number of samples
findings
In this article, we made the transition from the Fourier integral to the discrete Fourier transform by sampling the signal both in time and frequency. We obtained expressions for the direct and inverse DFT and considered some properties of the DFT. The properties of the DFT will be discussed in more detail in the following articles.

 - signal spectrum
  (in general, both the signal and the spectrum are complex).
 signal readings
  ,
,  , generally integrated,
  spectrum readings
  ,
,  .
. in the case of ODPP -
  . It can be noted that in the case of continuous conversion, the normalization coefficient
  It is designed to correctly display the scaling of the signal in time in the frequency domain and vice versa. In other words, if we sequentially calculate the spectrum of a certain signal, and then take the inverse Fourier transform, then the result of the inverse transform should completely coincide with the original signal. Normalization factor
  reduces the amplitude of the signal at the output of the inverse transform so that it coincides with the amplitude of the original signal.
 as a result of multiplying a continuous signal
  on the lattice function
 ,
, - delta function,
 - sampling interval. Graphically, the sampling process can be represented as shown in Figure 1.

 .
.
 varies on the entire number axis. However, it can be noted that the complex exponents under the sum sign in expression (7) are periodic functions with a period:
 excluded from expression (8), since
  complex exponent is one for all frequencies. Thus the maximum repetition period of the spectrum
  will be at
  and is equal to
 .
. at
at 
 then its spectrum will contain discrete harmonics multiple
  . Graphically, the process of repeating a signal in time is presented in Figure 2.
 .
. However, it is necessary that the repetition period be more than or equal to the duration of the signal, i.e.
  . The minimum repetition period of the signal
 .
. presented in Figure 3.

 will get
 with step
  and thereby
  spectrum readings. We take into account the above in expression (7), we get:
 and by frequency
  then we get the final expression for the DFT:
 discrete signal samples
  samples of the discrete spectrum, while it is assumed that both the signal and the spectrum are periodic and analyzed on the same period.
 ,
, - discrete spectrum readings on one repetition period
  . Substitute in the expression for the inverse Fourier transform (1):
 - the coefficient of proportionality, the task of which is to ensure equality in amplitude of the original discrete signal and the result of ODPP, the coefficient of proportionality takes into account the coefficient
  . Swapping the operations of summation and integration and take into account the filtering property of the delta function we get:
 after interval
  , then (17) can be written:


 , it is necessary to substitute the expression for calculating the spectrum using the DFT (14) in the expression for IDFT (20), we get:

 we get:
 . Let be
  then we get:
 .
. ,
, and they are turned relative to each other at the same angles. Since all vectors come from one point (from 0 of the complex plane) and are rotated relative to each other at the same angles, their sum is equal to zero. This is illustrated visually for
  in Figure 4.
 ,
,  ,
,  ,
,  , sums of complex exponentials (24) are really zero. Then in expression (22) of the amount of
  will only add to
  . Then you can write (22):
 . Thus, the expression for IDFT can be finally written down:
 and spectral
  counts without taking into account the sampling frequency. This allows the use of expressions for the DFT and IDFT at any sampling rate without changing the computational program. This is a definite plus of the DFT, and if you need to link the indices to the sampling frequency (to the real frequency axis), then you need to remember that the frequency spectrum was sampled in increments
  rad / c, or
  Hz where
  ,
,  - sampling rate in Hz. Thus, if the sampling rate is known, then
  - th spectral count corresponds to frequency
  happy / c or
  Hz For example, at the sampling rate
  kHz with
  ,
,  spectral count corresponds to the frequency
  kHz
kHz . Moreover, due to the periodicity of the spectrum of a discrete signal, the samples
  at
at  correspond to both frequencies
  and frequencies
  where
where  , i.e
, i.e  at
at  correspond to negative frequencies
  i.e. physically at
  the second half of the spectrum is the frequencies from -
  . This is vividly illustrated by figure 5. In order from the spectrum in the frequency range
  calculated using the discrete Fourier transform, obtain the spectrum of the signal in the interval
  it is necessary to swap the two halves of the spectral samples (see figure 5).
 for
for  then
then
 - even, then
 ,
,  and
and  :
:
 , then we can conclude:
  ,
,  that is, the second half of the spectral samples is complexly coupled with the first. Figure 6 shows a view of the real and imaginary parts of the complex spectrum of the real signal with an even
  . Red marked pure real
  and
and  .
.
Comments
To leave a comment
Digital signal processing
Terms: Digital signal processing