
Lecture
Reliability is a complex property of a product. To describe the various aspects of this property, reliability indicators are used in practice, representing quantitative characteristics of one or several properties that determine the reliability of a product.
In practice five groups of indicators are used: failure-free operation indicators; maintainability indicators; durability indicators; storability indicators; complex reliability indicators. All indicators, except the complex ones, are classified as single indicators. A single indicator is understood as one that characterizes one of the properties making up the reliability of a product: either failure-free operation, or maintainability, etc.
A complex indicator characterizes several properties from among those making up the reliability of a product (two or more properties).
The main single reliability indicators used in engineering practice are shown in Fig. 2.1. They are written using their conventional designations, an explanation of which is given in Table 2.1.
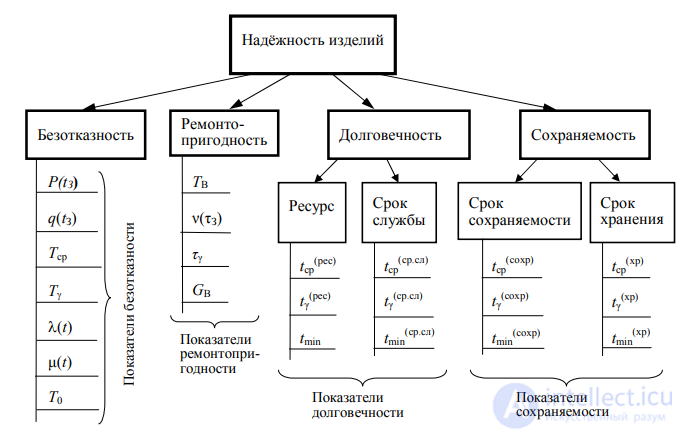
Fig. 2.1. Main components and indicators of reliability
Table 2.1 Explanations of reliability indicators
|
Indicator designation |
Explanation of the reliability indicator |
|
|
Failure-free operation indicators |
|
P(tZ)
q(tZ)
Tsr
T0 |
Probability of failure-free operation for the given (time of interest) tZ
Probability of failure for the given time tZ
Mean time to failure. If the operating time is expressed in time units, the indicator is called the mean time of failure-free operation
Gamma-percentile operating time to failure (usually γ ≥ 90 %)
Failure rate, in the general case a function of time. Used as the main reference characteristic of the failure-free operation of components, with
Mean time between failures, in short – time between failures. Has physical meaning only for repairable RED |
End of Table 2.1
|
Indicator designation |
Explanation of the reliability indicator |
|
|
Maintainability indicators |
|
TV
ν(τZ)
τγ
GV |
Mean recovery (repair) time of the RED. Represents the mathematical expectation of the recovery time
Probability of recovery of the RED within the given time τZ
Gamma-percentile recovery time (usually γ ≥ 90 %)
Mean recovery costs of the RED. Shows how much money on average will be needed to restore the operability of the RED |
|
|
Durability indicators |
|
tsr(res)
tγ(res)
tmin
tsr(sr.sl)
tγ(sr.sl)
tmin(sr.sl) |
Mean resource of the product. Represents the mathematical expectation of the resource of products of the type under consideration
Gamma-percentile resource (usually γ ≥ 90 %)
Minimum operating time. Characterizes the resource capability of the product; it is considered that tmin corresponds to the value tγ(res) at γ = 99.99 %
Mean service life of the product. Represents the mathematical expectation of the service life of products of the type under consideration
Gamma-percentile service life (usually γ ≥ 90 %)
Minimum service life. It is considered that tmin(sr.sl) corresponds to the gamma-percentile service life tγ(sr.sl) at γ = 99.99 % |
|
|
Storability indicators |
|
tsr(sokhr)
tγ(sokhr)
tmin(sokhr)
tsr(khr)
tγ(khr)
tmin(khr) |
Mean storability period of the product. Represents the mathematical expectation of the storability period of products of the type under consideration
Gamma-percentile storability period (usually γ ≥ 90 %)
Minimum storability period. It is considered that tmin(sokhr) corresponds to the value tγ(sokhr) at γ = 99.99 %
Mean storage period of the product. Represents the mathematical expectation of the storage period of products of the type under consideration
Gamma-percentile storage period (usually γ ≥ 90 %)
Minimum storage period. It is considered that tmin(khr) corresponds to the gamma-percentile storage period tγ(khr) at γ = 99.99 % |
Probability of failure-free operation. By the probability of failure-free operation of a product over the time tZ is understood the probability of the form
 (2.1)
where T – the random time of failure-free operation of the product (time to failure).
If the probability density function of the time to failure w(t) is known, the probability of failure-free operation of the product over time tz can be determined as
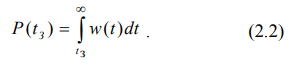
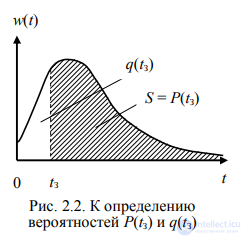
The geometric interpretation of expression (2.2) is clear from Fig. 2.2.
In the case of an exponential distribution of the time to failure, using expression (2.2) one can obtain

where  – the parameter of the exponential distribution for the product under consideration.
Formula (2.3) is widely used in engineering calculations. It is also known under the name exponential law of reliability.
Failure rate. By the failure rate of components for the time interval Δti is understood the value of the conditional probability density of the time to failure, given that no failures occurred before the start of the moment in question Δti. Using test results, the failure rate can be numerically determined as
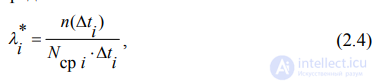
where n(∆ti) – the number of components that failed in the i-th time interval;
Nsr i – the mean number of components that operated without failure in the i-th time interval;
∆ti – the width of the i-th time interval.
Mean time of failure-free operation. The reliability of RED or components of the same type, from the point of view of the duration of their operation until the first failure, is characterized by the mean time of failure-free operation, understood as the mathematical expectation of the time of failure-free operation. In the general case the indicator under consideration is called the mean time to failure, since it represents the mathematical expectation (mean value) of the random variable – the time to failure. This indicator can be used for any products: repairable and non-repairable.
Gamma-percentile operating time to failure. By this is understood the operating time during which a failure will not occur in the product with a probability γ, expressed as a percentage. A statement in the technical documentation: “the 90-percent operating time to failure is not less than 500 h” means that for 90 % of products of the given type no failure will occur during a total operating time equal to 500 h.
Time between failures (mean time between failures). On the time axis let us depict the processes of operation and elimination of failures of a RED (a single unit) over some calendar Time period (Fig. 2.3).
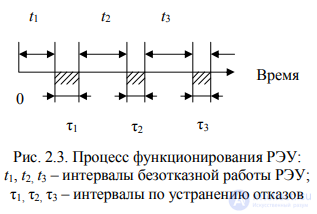
Then the time between failures can be determined as
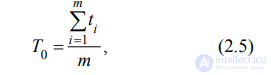
where m – the number of failures of the RED that occurred during the calendar period considered, or, what is the same thing, the number of periods of failure-free operation.
The indicator T0 has physical meaning only for repairable devices. It is more fully called the mean time between failures, as is clear from expression (2.5).
The indicators T0 and Tsr differ in their physical essence, however in the case of an exponential distribution of the time to failure they coincide in value and correspond to approximately the 37 %-percentile operating time to failure (γ ≈ 37 %). This means that approximately 37 % of RED of the given type will operate without failure over a time t ≥ T0. It can also be shown that for an exponential distribution of the time to failure the following relations hold [11]:

Probability of recovery of a RED. By the probability of recovery of a device within the given time τZ is understood the probability of the form

where T – the random recovery time of the device.
The formulas for calculating the values of the probability ν(τZ) depend on the distribution law of the recovery time. Usually the hypothesis of an exponential distribution of the recovery time is used. In this case the calculation formula has the form

where TV – the mean recovery time.
Mean recovery time. By this is understood the mathematical expectation of the time needed to restore the RED to an operable state after a failure. The mean recovery time is determined by analogy with the indicator T0 (see Fig. 2.3):

The value TV shows how much time on average is spent detecting and eliminating one failure. The time spent on resolving organizational issues, searching for and delivering the necessary components, etc., is not included in TV.
Explanations of other reliability indicators are given in [1, 2, 4].


 taken at an operating time equal to tn (a specific value of tn in hours is indicated)

Comments