
Lecture
Visualization or drawing of graphs, as a branch of graph theory related to topology and geometry — is a two-dimensional representation of a graph. Basically, it is a graphical representation of an embedding of a graph in the plane (as a rule, crossing of edges is allowed), usually aimed at a convenient display of certain properties of the graph, or of the object being modeled.
The problem of graph visualization arises, for example, in the display of large integrated circuits, in the analysis of social networks, in such areas as cartography and bioinformatics.
Graphs are, as a rule, displayed graphically using points to represent vertices and segments, or polylines, to display edges between connected vertices. The orientation of an edge (in a digraph) is displayed using an arrow. Here the drawing of a graph should not be confused with the graph itself (an abstract, non-geometric structure). For each graph there are many different ways of drawing it. Abstractly, they all reduce to ways of displaying vertices and edges. More concretely, what matters is the placement of these vertices and edges, ease of perception and use, cost of creation and aesthetic criteria.
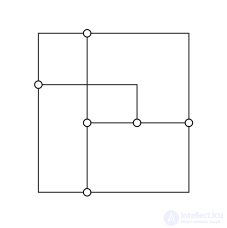
Orthogonal drawing of a graph
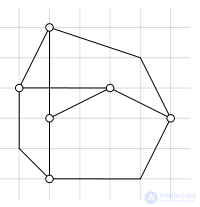
Grid drawing of a graph
Because of the great variety of kinds of graphs, there are many different ways of drawing graphs.
For example, for graphs with a small number of vertices and a comparable number of edges, a straight-line representation may be the most convenient. An example of such a system can be the road system of a city. But for a social-network graph a straight-line drawing, because of the large number of arcs, will clearly be insufficient.
The following drawing methods can be distinguished :
Aesthetic criteria determine the parameters of the drawing. The most common among them:
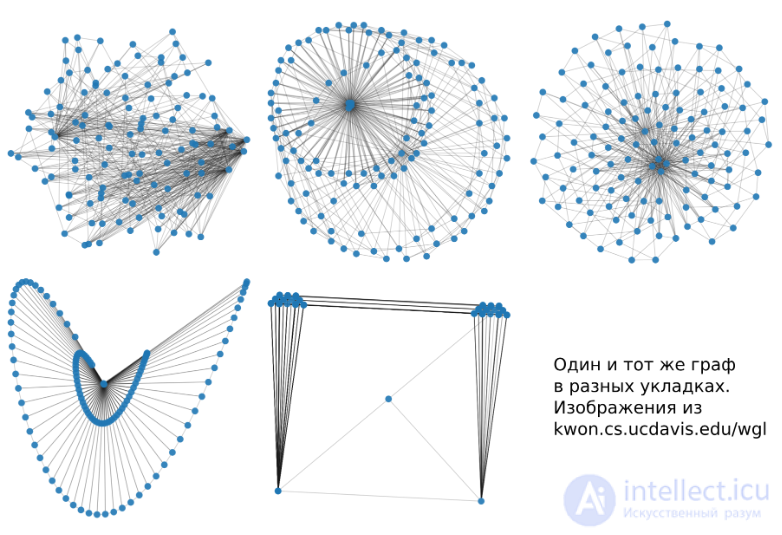
A layout — is a way of assigning coordinates to each vertex of a graph. Usually one is talking about coordinates in the plane, although generally speaking it need not be a plane. It is simply almost never necessary to use more than 2 dimensions.
The most important are these three kinds of layouts, although many classifications and types can be devised. However, knowledge of these types is enough to find one's way in the subject.
These methods use the simulation of physical forces. Vertices are represented as charged particles that repel each other, and edges — as elastic strings that pull adjacent vertices together. Then the motion of the vertices in such a system is simulated until a stable state is established. In other approaches one tries to describe the potential energy of such a system and to find the position of the vertices that corresponds to the minimum.
The advantages of this family of algorithms are in the quality of the picture. Usually one really does get a good layout that reflects the topology of the graph. The disadvantages are in the number of parameters that need to be tuned. And, of course, the computational complexity. For each vertex one must compute the forces acting from all the other vertices.
Important algorithms of the family — Force Atlas, Fruchterman-Reingold, Kamada Kawaii and OpenOrd. The last algorithm — uses clever optimizations, for example it cuts off long edges to speed up the computations, and as a side effect one gets denser clusters of close vertices.
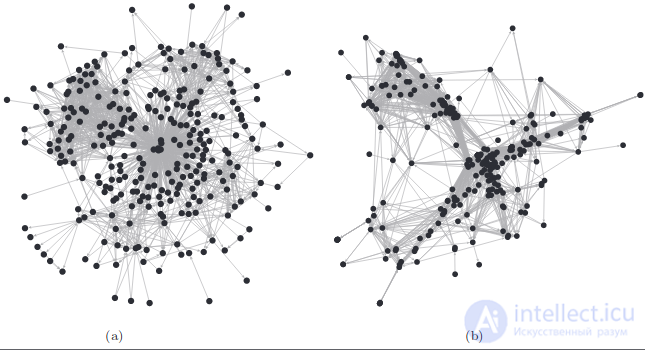
A graph can be specified by an adjacency matrix, that is, a square NxN matrix, where N — is the number of vertices. This can be interpreted as N objects in a space of dimension N. Such a representation makes it possible to use universal dimensionality-reduction methods, like tSNE, UMAP, PCA and so on. Another approach is based on computing theoretical distances between vertices, based on edge weights and knowledge of the local topology, and then trying to preserve the relationships between these distances when passing to a lower-dimensional space.
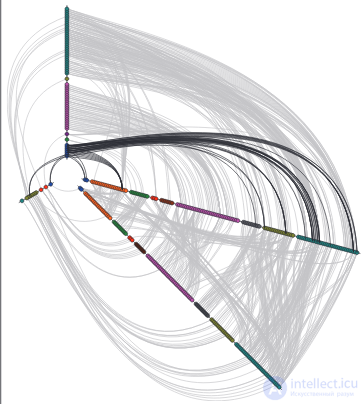
Usually data comes from the real world, where we have not only information about the adjacency of vertices. Vertices are some real objects with their own properties. Bearing this in mind, we can use the properties of the vertices to display them in the plane. For this one can use any approaches usually applied to tabular data. These are the already mentioned above dimensionality-reduction methods PCA, UMAP, tSNE, Autoencoders. Or one can draw a simple scatter plot for pairs of features and draw the edges on top of the resulting representation. Separately one can mention the Hive Plot — an interesting method where different axes directed from the center correspond to feature values, on which the vertices are placed, and the edges are drawn as arcs between them.
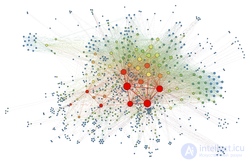
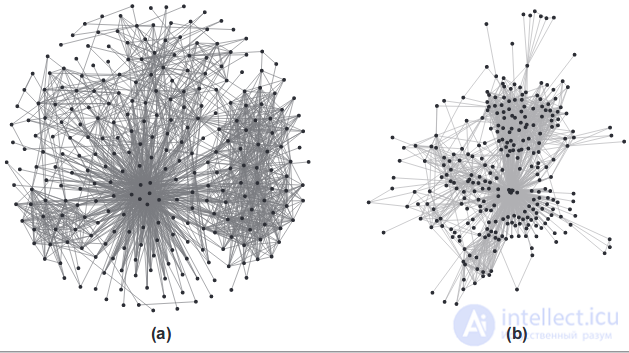
Visualization of a social network using a force-directed graph drawing algorithm
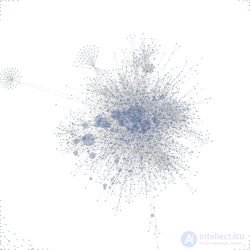
Visualization of page links in a Wiki using a force-directed layout algorithm.
Force-directed graph drawing algorithms — a class of algorithms for visualizing graphs in an aesthetically pleasing form. Their goal — is to place the nodes of the graph in two- or three-dimensional space so that all edges would have a more or less equal length, and to minimize the number of edge crossings by assigning forces to the set of edges and nodes based on their relative positions, and then using these forces either to simulate the motion of the edges and nodes, or to minimize their energy.
While graph visualization can turn out to be a difficult task, force-directed algorithms, being physical models, usually do not require special knowledge of graph theory, such as the planarity of a graph.
Force-directed graph drawing algorithms assign forces to the set of edges and nodes of the graph. Usually spring-like attractive forces based on Hooke's law are used to assign forces to pairs of endpoints of a graph edge. At the same time repulsive forces, similar to the repulsion of electrically charged particles based on Coulomb's law, are used to separate all pairs of nodes. To obtain an equilibrium state of this system of forces, the edges tend to obtain uniform lengths (due to the action of the springs), and nodes not joined by an edge tend to be placed far apart from each other (due to the action of the repulsive forces). The attractive forces (edges) and the repulsive forces (nodes) can be defined using functions that are not based on the physical behavior of springs and particles. For example, some force systems use springs whose forces change logarithmically rather than linearly.
An alternative model considers spring-like forces for each pair of nodes e (i,j) , where the ideal length  of each spring is proportional to the distance in the graph between nodes i and j, and repulsive forces are not used. Minimizing the difference (usually, the square of the difference) between the Euclidean and the ideal distance between nodes is equivalent to the metric multidimensional scaling problem.
A force graph can use forces other than mechanical springs and charge-repulsion forces. A force analogous to gravity can be used to attract vertices toward a fixed point of the graph-drawing space. This can be used to bring together the various connected components of a disconnected graph into a single whole; otherwise these parts would fly apart from each other under the action of the repulsive forces. This also makes it possible to obtain nodes with an improved central position in the drawing. It can also affect the distance between vertices in one connected component. Analogues of magnetic fields can be used for directed graphs. Repulsive forces can be placed both on edges and on nodes in order to avoid overlap or near-overlap in the final drawing. In drawings with curved edges, such as circular arcs or splines, forces can also be placed at the control points of these curves, for example, to improve the angular resolution.
As soon as the forces on the nodes and edges are defined, the behavior of the whole graph under the action of these forces can be iteratively simulated, as if it were a physical system. In such a situation the forces acting on the nodes try to pull them closer or push them farther apart. This continues until the system reaches a state of mechanical equilibrium, that is, the position of the nodes does not change from iteration to iteration. The positions of the nodes in this equilibrium state are used to generate the drawing of the graph.
For forces defined from springs whose ideal length is proportional to the distance in the graph, stress majorization gives very good behavior (that is, monotone convergence) and a mathematically elegant way of minimizing this difference and, consequently, of arriving at a good placement of the graph's vertices.
One can also use mechanisms that seek an energy minimum more directly, rather than by a physical model. Such mechanisms, being examples of general methods of global optimization, include simulated annealing and genetic algorithms.
The following properties are the most important advantages of force-directed algorithms:
Good-quality results
At least for graphs of medium size (up to 50-500 vertices), the obtained results usually have very good graph drawings by the following criteria: uniformity of edge lengths, uniform distribution of vertices, and symmetry. The last criterion is the most important and hard to achieve in other types of algorithms.
Flexibility
Force-directed algorithms can be easily adapted and extended for additional aesthetic criteria. This makes the algorithms more universal classes of graph-visualization algorithms. Examples of existing extensions are algorithms for directed graphs, visualization of three-dimensional graphs, cluster visualization of graphs, visualization of graphs with constraints, and dynamic visualization of graphs.
Intuitiveness
Since the algorithms are based on physical analogues of familiar objects, like springs, the behavior of the algorithms is relatively easy to predict and understand. This is not the case in other types of graph-visualization algorithms.
Simplicity
Typical force-directed algorithms are simple and can be implemented in a few lines of code. Other classes of visualization algorithms, such as algorithms based on orthogonal placements, usually require much more work.
Interactivity
Another advantage of this class of algorithms is the aspect of interactivity. When drawing the intermediate stages of the graph, the user can follow how the graph changes, tracing the evolution from a disorderly jumble into a good-looking configuration. In some interactive graph-drawing tools the user can pull one or several nodes out of the equilibrium state and observe the migration of the nodes into a new equilibrium state. This gives the algorithms an advantage for dynamic and online graph-visualization systems.
Strong theoretical support
While simple force-directed algorithms often appear in the literature and in practice (since they are relatively simple and understandable), the number of more rigorous approaches is beginning to grow. Statisticians solved similar problems in multidimensional scaling (MDS) since the 1930s, and physicists also have a long history of working with related problems of simulating the motion of n bodies[en], so there exist quite mature approaches. As an example, the stress-majorization approach to metric MDS can be applied to graph visualization, and in this case monotone convergence can be proved. Monotone convergence, the property that the algorithm will at each iteration decrease the stress or cost of the placement of vertices, is important, since it guarantees that the placement will, in the end, reach a local minimum and the algorithm will stop. Damping of oscillations leads to the stopping of the algorithm, but does not guarantee that a true local minimum will be reached.
The main disadvantages of force-directed algorithms:
Long running time
Typical force-directed algorithms in the general case, as is believed, have a running time equivalent to O(n3), where n — is the number of nodes of the input graph. This is because the number of iterations is estimated at O(n), and at each iteration it is necessary to look through all pairs of nodes and compute the mutual repulsive forces. This is similar to the N-body problem in physics. However, since the repulsive forces are local in nature, the graph can be partitioned so that only neighboring vertices are considered. The main techniques used by algorithms to determine the placement of nodes of large graphs include high-dimensional embeddings, multilevel representations, and other methods related to modeling the n-body problem. For example, the FADE method based on Barnes-Hut simulation can improve the running time to n*log(n) per iteration. As a rough estimate, in a few seconds one can expect to draw at most 1000 nodes with the standard n2-per-iteration technique and 100000 with the n*log(n)-per-iteration technique. Force-directed algorithms, when combined with a multilevel approach, can draw graphs with millions of nodes.
Poor local minima
It is easy to see that a force-directed algorithm gives a graph with minimal energy, in particular, this may be only a local minimum. The found local minimum may, in many cases, be substantially worse than the global minimum, which leads to a poor-quality representation. For many algorithms, especially for those that allow only gradient-descent motion, the final result can be strongly influenced by the initial position, which in most cases is generated randomly. The problem of a poor local minimum becomes especially important as the number of vertices of the graph grows. Combining various algorithms helps to solve this problem . For example, one can use the Kamada — Kawai algorithm to quickly generate an acceptable initial placement, and then the Fruchterman — Reingold algorithm to improve the position of neighboring nodes. Another technique for obtaining a global minimum — is the use of a multilevel approach .
Force-directed methods of graph visualization go back to the work of Tutte, in which he showed that polyhedral graphs can be drawn in the plane with convex faces by fixing the vertices of the outer face of a planar embedding of the graph in a convex position, placing spring-like attractive forces on each edge, and allowing the system to come to an equilibrium state . Because of the simple nature of the forces in this case, the system cannot get stuck in a local minimum, but converges to a unique globally optimal configuration. Because of this article, embeddings of planar graphs with convex faces are sometimes called Tutte embeddings.
The combination of attractive forces of adjacent vertices of a graph and repulsive forces for all vertices was first used by Eades . Another pioneering work on this type of force-directed placement was published by Fruchterman and Reingold. The idea of using only spring forces between all pairs of vertices with ideal spring lengths equal to the graph distance belongs to Kamada and Kawai
There are libraries for graph visualization in JS, Java, PHP, SQL
Non-SQL for working with graphs, including visualization
here is an example of such a DB
http://console.neo4j.org/
https://neo4j.com/
Visualization of a flexible force-directed graph is carried out using the Verlet numerical integration method, JS library https://github.com/d3/d3
library https://www.graphviz.org/
and others

Comments