
Lecture
Graph theory — is a branch of discrete mathematics that studies the properties of graphs. In the general sense, a graph is represented as a set of vertices (nodes) connected by edges. In the strict definition, a graph is a pair of sets  , where
  is a subset of some countable set, and
  — is a subset of
  .
.
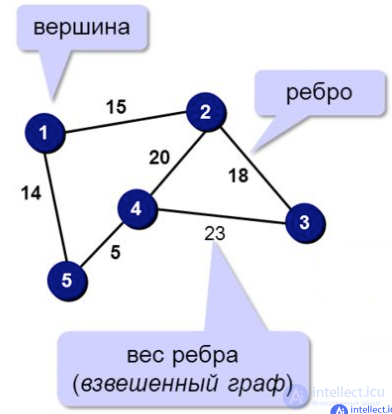
In mathematics , graph theory is the study of graphs, which are mathematical structures used to model pairwise relationships between objects. A graph in this context consists of vertices (also called nodes or points ) that are connected by edges (also called links or lines ). A distinction is made between undirected graphs , where edges connect two vertices symmetrically, and directed graphs , where edges link two vertices asymmetrically; see graph (discrete mathematics) for more detailed definitions and other varieties of commonly considered types of graphs. Graphs are one of the main objects of study in discrete mathematics .
Graph theory finds application, for example, in geoinformation systems (GIS). Existing or newly designed houses, structures, blocks, etc. are regarded as vertices, and the roads, utility networks, power lines, etc. connecting them — as edges. The application of various computations performed on such a graph makes it possible, for example, to find the shortest detour route or the nearest grocery store, and to plan an optimal route.
Graph theory contains a large number of unsolved problems and as-yet-unproven conjectures.
Leonhard Euler is considered the founder of graph theory. In 1736, in one of his letters, he formulates and proposes a solution to the problem of the seven bridges of Königsberg, which later became one of the classical problems of graph theory. The term «graph» was first introduced by Sylvester, James Joseph in 1878 in his article in Nature .
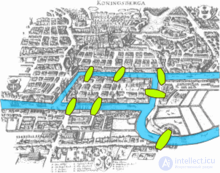
The Königsberg bridge problem
Leonhard Euler's paper on the seven bridges of Königsberg, published in 1736, is considered the first paper in the history of graph theory. In this paper, as well as in the paper written by Vandermonde on the knight's problem , the analysis situs initiated by Leibniz was continued . Euler's formula , relating the number of edges, vertices, and faces of a convex polyhedron, was studied and generalized by Cauchy and L'Huilier , and represents the beginning of the branch of mathematics known as topology .
More than a century after Euler's paper on the bridges of Königsberg, and while Listing was introducing the concept of topology, Cayley was led by an interest in certain analytical forms arising from differential calculus to the study of a particular class of graphs - trees . This research was of great importance to theoretical chemistry . The techniques he used mainly concern the enumeration of graphs with certain properties. Enumerative graph theory then arose on the basis of Cayley's results and the fundamental results published by Pólya between 1935 and 1937. They were generalized by De Bruijn in 1959. Cayley connected his results on trees with contemporary research on chemical composition. The merging of ideas from mathematics with ideas from chemistry laid the foundation for what became part of the standard terminology of graph theory.
In particular, the term «graph» was introduced by Sylvester in a paper published in 1878 in the journal Nature , where he draws an analogy between «quantum invariants» and «co-variants» of algebra and molecular diagrams:
«[…] Thus, every invariant and covariant becomes expressible by means of a graph exactly identical to a Kekuléan diagram or chemicograph. […] I give a rule for the geometric multiplication of graphs, that is for constructing a graph from the product of the in- or co-variants whose separate graphs are given. […] » (italics as in the original).
The first textbook on graph theory was written by Dénes Kőnig and published in 1936. Another book, by Frank Harary , published in 1969, was «considered throughout the world to be the definitive textbook on the subject» and enabled mathematicians, chemists, electrical engineers, and sociologists to communicate with each other. Harary donated all royalties to fund the Pólya Prize .
One of the most famous and stimulating problems in graph theory is the four color problem : «Is it true that any map drawn on the plane can have its regions colored with four colors in such a way that any two regions having a common border have different colors?" This problem was first posed by Francis Guthrie in 1852, and the first written mention of it is contained in a letter from De Morgan addressed to Hamilton in the same year. Many incorrect proofs were proposed, including by Cayley, Kempe, and others. The study and generalization of this problem by Tait , Heawood , Ramsey, and Hadwiger led to the study of graph colorings embedded on surfaces of arbitrary genus . Tait's reformulation gave rise to a new class of problems - factorization problems , especially studied by Petersen and Kőnig . Ramsey's work on coloring and, in particular, the results obtained by Turán in 1941, laid the foundation for another branch of graph theory, extremal graph theory .
The four color problem remained unsolved for more than a century. In 1969, Heinrich Heesch published a method for solving the problem using computers. The computer proof, produced in 1976 by Kenneth Appel and Wolfgang Haken, fundamentally uses the concept of «discharging» developed by Heesch. The proof involved checking the properties of 1936 configurations on a computer and was not fully accepted at the time due to its complexity. A simpler proof, considering only 633 configurations, was given twenty years later by Robertson , Seymour , Sanders, and Thomas
The autonomous development of topology from 1860 to 1930 fostered the development of graph theory through the works of Jordan , Kuratowski, and Whitney . Another important factor in the general development of graph theory and topology was the use of the methods of modern algebra. The first example of such use is the work of the physicist Gustav Kirchhoff , who published in 1845 his Kirchhoff's laws for calculating voltage and current in electric circuits .
The introduction of probabilistic methods into graph theory, especially in the study by Erdős and Rényi of the asymptotic probability of graph connectivity, gave rise to yet another branch, known as random graph theory , which has been a fruitful source of theoretical results.
The terminology of graph theory is still not strictly defined. In particular, in the monograph Goodman, Hedetniemi, 1981 it is stated: «In the programming world there is no consensus on which of the two terms „graph“ or „network“ to use. We have chosen the term „network“, since it appears to occur more often in applied fields». A similar situation exists with the terms «vertex/point».
Types of graphs:
Definitions in graph theory vary. Below are some of the main ways of defining graphs and related mathematical structures .
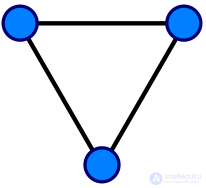
A graph with three vertices and three edges.
In one restricted , but very general sense of the term, a graph is an ordered pair comprising:
, a set of vertices (also called nodes or points ); , a set of edges (also called links or lines ), which are unordered pairs of vertices (that is, an edge is associated with two distinct vertices).
To avoid ambiguity, this type of object can be called precisely an undirected simple graph .
In an edge  , the vertices
  and
and  are called the endpoints of the edge. It is said that the edge joins x and and is incident on and on . A vertex may exist in a graph and not belong to any edge. Multiple edges , which are not permitted under the above definition, are two or more edges that connect the same two vertices.
In a more general sense of the word, allowing multiple edges, a graph is an ordered triple 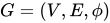 comprising:
, a set of vertices (also called nodes or points );, a set of edges (also called links or lines ); , an incidence function, mapping each edge to an unordered pair of vertices (that is, an edge is associated with two distinct vertices).
To avoid ambiguity, this type of object can be called precisely an undirected multigraph .
A loop is an edge that connects a vertex to itself. Graphs, as defined in the two definitions above, cannot have loops, because a loop connecting a vertex to itself is an edge (for an undirected simple graph) or incident (for an undirected multigraph) 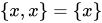 which is not in
  . Therefore, to allow loops, the definitions must be extended. For undirected simple graphs, the definition should be changed to
  . For undirected multigraphs, the definition
  should be changed to
  . To avoid ambiguity, these types of objects can be called undirected loop-permitting simple graphs and loop-permitting undirected multigraphs respectively.
and are usually assumed to be finite, and many of the well-known results are false (or very different) for infinite graphs, because many of the arguments fail in the infinite case . Moreover, is often assumed to be nonempty, but may be the empty set. The order of a graph is  , its number of vertices. The size of a graph is
  , its number of edges. The degree or valence of a vertex is the number of edges incident to it, where a loop is counted twice.
In an undirected simple graph of order n, the maximum degree of each vertex is n - 1, and the maximum size of the graph is n ( n - 1) / 2 .
The edges of an undirected simple graph permitting loops  induce a symmetric homogeneous relation ~ on the vertices which is called the adjacency relation of . Concretely, for each edge
  , its endpoints and are called adjacent to each other, which is denoted ~ .
Directed graph
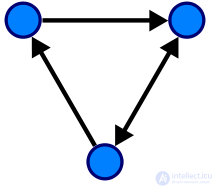
A directed graph with three vertices and four directed edges (the double arrow represents an edge in each direction).
A directed graph or digraph is a graph in which the edges have an orientation.
In one restricted , but very general sense of the term, a directed graph is an ordered pair comprising:
, a set of vertices (also called nodes or points ); , a set of edges (also called directed edges , directed links , directed lines , arrows or arcs ) which are ordered pairs of vertices (that is, an edge is associated with two distinct vertices).
To avoid ambiguity, this type of object can be called precisely a directed simple graph .
In an edge directed from to , the vertices and are called the endpoints of the edge, the tail of the edge and the head of the edge. It is said that the edge joins and is incident on and on . A vertex may exist in a graph and not belong to any edge. The edge  is called the inverted edge of . Multiple edges , which are not permitted under the above definition, are two or more edges with the same tail and the same head.
In a more general sense of the word, allowing multiple edges, a directed graph is an ordered triple comprising:
, a set of vertices (also called nodes or points );, a set of edges (also called directed edges , directed links , directed lines , arrows or arcs ); , an incidence function, mapping each edge to an ordered pair of vertices (that is, an edge is associated with two distinct vertices).
To avoid ambiguity, this type of object can be called precisely a directed multigraph .
A loop is an edge that connects a vertex to itself. Directed graphs, as defined in the two definitions above, cannot have loops, because a loop connecting a vertex to itself is an edge (for a directed simple graph) or incident (for a directed multigraph)  which is not in
  . Therefore, to allow loops, the definitions must be extended. For directed simple graphs, the definition should be changed to
  . For directed multigraphs, the definition should be changed to
  . To avoid ambiguity, these types of objects can be called precisely a loop-permitting directed simple graph, and a loop-permitting directed multigraph (or quiver ) respectively.
The edges of a directed simple graph permitting loops is a homogeneous relation ~ on the vertices which is called the adjacency relation of . Concretely, for each edge , its endpoints and are called adjacent to each other, which is denoted ~ .
There are various ways of storing graphs, each of which is suited to different tasks and types of graphs (sparse, dense, directed, undirected, etc.). Below — are the main methods with a brief description, advantages and disadvantages.
Description:
A square n x n matrix, where n — is the number of vertices.
The cell [i][j] contains:
1 (or the weight) — if there is an edge from i to j
0 — if there is no edge
Advantages:
Fast O(1) access to information about the presence of an edge
Convenient for dense graphs
Disadvantages:
Takes up O(n²) of memory — inefficient for sparse graphs
Description:
For each vertex a list of all neighboring vertices is stored (in the form of an array, list, or hash table).
Example:
A: B, C B: A C: A
Advantages:
Compact storage: O(n + m) where m — is the number of edges
Convenient for sparse graphs
Disadvantages:
Searching for the presence of a specific edge takes O(k), where k — is the degree of the vertex
Description:
Simply a list of all edges as pairs (or triples, if the graph is weighted):
(A, B), (A, C), (B, C) or (A, B, 3) — if the weight is 3
Advantages:
Simple and universal format
Convenient for iterating over edges
Disadvantages:
Slow search for specific edges
Inefficient for some algorithms
Description:
An n x m matrix, where n — are the vertices, m — the edges.
If vertex i is incident to edge j, then the cell [i][j] = 1 (or -1, if the graph is directed).
Advantages:
Clearly reflects vertex–edge connections
Suitable for theoretical problems and matrix computations
Disadvantages:
Takes up a lot of memory
Not as intuitive as the adjacency list
Description:
For directed graphs: for each vertex the incoming and/or outgoing vertices are stored separately.
Convenient when it is important to distinguish directions.
Vertices: A, B, C Edges: (A, B), (A, C)
Adjacency matrix:
  A B C
A 0 1 1
B 1 0 0
C 1 0 0
Adjacency list:
A: B, C B: A C: A
Edge list:
(A, B), (A, C)
A graph can be defined as an ordered pair of sets:
G=(V,E)where:
V — the set of vertices (nodes)
E⊆V ×V — the set of edges
E⊆{{u,v}∣u,v∈V, u=v}
Edges — unordered pairs
Example:
V={A,B,C}E={{A,B},{A,C}}
}E⊆{(u,v)∣u,v∈V}
Edges — ordered pairs
Example:
V={A,B,C}
E={(A,B),(A,C)}
Additionally a weight function is specified:
}w:E→RExample:
V={A,B,C}
E={(A,B),(B,C)}
w(A,B)=3,
w(B,C)=5
Formal and unambiguous
Convenient for proofs and mathematical reasoning
A basis for constructing other representations (matrices, lists, etc.)
Here is how a graph can be represented as an FSM (Finite State Machine) class structure — a finite automaton — in a programming language, for example in Python, taking into account all the representations (including set theory).
States — the vertices of the graph (V)
Transitions — the edges of the graph (E)
Transitions can be directed (as in a directed graph)
They can be weighted (if events, actions, or weights are added)
Here is how a graph can be implemented as an FSM (finite automaton) in — JavaScript, in the ES6 class style.
class FSM {
  constructor() {
    this.states = new Set();               // Set of vertices (states)
    this.transitions = new Map();          // Mapping: fromState -> Map(toState -> event)
  }

  addState(state) {
    this.states.add(state);
    if (!this.transitions.has(state)) {
      this.transitions.set(state, new Map());
    }
  }

  addTransition(fromState, toState, event = null) {
    this.addState(fromState);
    this.addState(toState);
    this.transitions.get(fromState).set(toState, event);
  }

  getStates() {
    return Array.from(this.states);
  }

  getTransitions() {
    const result = [];
    for (const [from, edges] of this.transitions.entries()) {
      for (const [to, event] of edges.entries()) {
        result.push({ from, to, event });
      }
    }
    return result;
  }

  print() {
    console.log("States:", this.getStates());
    console.log("Transitions:");
    for (const { from, to, event } of this.getTransitions()) {
      console.log(`  ${from} → ${to} ${event ? `(event: ${event})` : ''}`);
    }
  }
}
const fsm = new FSM();
fsm.addTransition("A", "B", "go_to_B");
fsm.addTransition("A", "C", "go_to_C");
fsm.print();
Console output:
States: [ 'A', 'B', 'C' ]
Transitions:
   A → B (event: go_to_B)
   A → C (event: go_to_C)
// Set of states:
const V = new Set(["A", "B", "C"]);

// Set of transitions (edges as ordered pairs):
const E = new Set([
  ["A", "B"],
  ["A", "C"]
]);

// Weights or events of transitions:
const w = new Map([
  [["A", "B"], "go_to_B"],
  [["A", "C"], "go_to_C"]
]);
JavaScript does not support sets of pairs directly, but conceptually this approximates writing the graph as:
G=(V,E),
w:E→Events
| Task | Recommended method |
|---|---|
| Finding neighbors | Adjacency list |
| Checking the presence of an edge | Adjacency matrix |
| Frequent operations with edges | Edge list |
| Theoretical analysis | Incidence matrix |
Graphs can be used to model many types of relationships and processes in physical, biological, social, and information systems. Many practical problems can be represented in the form of graphs. Emphasizing their application to real-world systems, the term network is sometimes defined to denote a graph in which attributes (for example, names) are associated with the vertices and edges, and the discipline that expresses and understands real-world systems as a network is called network science .
In computer science, graphs are used to represent communication networks, data organization, computing devices, the flow of computation, states and their transitions, etc. For example, the link structure of a website can be represented by a directed graph in which the vertices represent web pages and the directed edges represent links from one page to another. A similar approach can be applied to problems in social networks , travel, biology, computer chip design, mapping the progression of neurodegenerative diseases and many other areas. Therefore, the development of algorithms for handling graphs is of great interest in computer science. Graph transformations are often formalized and represented by graph rewriting systems . Complementary to graph transformation systems focused on rule-based in-memory manipulation of graphs are graph databases oriented toward transaction-safe , persistent storage and querying of structured graph data .
Graph-theoretic methods in various forms have proved especially useful in linguistics , since natural language often lends itself well to discrete structure. Traditionally, syntax and compositional semantics follow tree-based structures, whose expressive power lies in the principle of compositionality , modeled as a hierarchical graph. More modern approaches, such as head-driven phrase structure grammar, model the syntax of natural language using typed feature structures , which are directed acyclic graphs . In lexical semantics, especially as applied to computers, modeling the meaning of a word is easier when a given word is understood in terms of related words; therefore semantic networks are important in computational linguistics . Nevertheless, other methods in phonology (for example, optimality theory , which uses lattice graphs ) and morphology (for example, finite-state morphology, using finite-state transducers ) are common in the analysis of language as a graph. Indeed, the usefulness of this area of mathematics for linguistics has given rise to organizations such as TextGraphs , as well as various «Net» projects, such as WordNet , VerbNet , and others.
Graph theory is also used to study molecules in chemistry and physics . In condensed matter physics, the three-dimensional structure of complex simulated atomic structures can be studied quantitatively by collecting statistics on graph-theoretic properties related to the topology of the atoms. Moreover, « Feynman graphs and the rules of calculation summarize quantum field theory in a form in close contact with the experimental numbers one wants to understand». In chemistry, a graph is a natural model of a molecule, where the vertices represent atoms and the edges bonds. This approach is especially used in the computer processing of molecular structures, from chemical editors to database searching. In statistical physics, graphs can represent local connections between interacting parts of a system, as well as the dynamics of a physical process in such systems. Similarly, in computational neuroscience, graphs can be used to represent the functional connections between brain regions that interact to produce various cognitive processes, where the vertices represent different brain regions and the edges represent connections between those regions. Graph theory plays an important role in the electrical modeling of electrical networks; here weights are associated with the resistance of wire segments in order to obtain the electrical properties of network structures. Graphs are also used to represent the microscale channels of porous media , in which the vertices represent pores and the edges represent the smaller channels connecting the pores. Chemical graph theory uses the molecular graph as a means of modeling molecules. Graphs and networks are excellent models for studying and understanding phase transitions and critical phenomena. The removal of nodes or edges leads to a critical transition when the network breaks up into small clusters, which is regarded as a phase transition. This breakdown is studied by means of percolation theory.
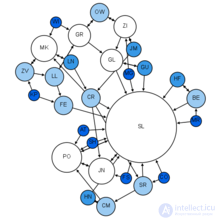
Graph theory in sociology: Moreno's sociogram (1953).
Graph theory is also widely used in sociology as a way, for example, to measure the prestige of actors or to study the spread of rumors , in particular by means of social network analysis software . Under the umbrella of social networks there are many different types of graphs. Acquaintance and friendship graphs show whether people know each other. Influence graphs model whether some people can influence the behavior of others. Finally, collaboration graphs model whether two people work together in a certain way, for example, appear together in a film.
Similarly, graph theory is useful in biology and conservation efforts, where a vertex may represent regions where certain species exist (or inhabit), and the edges represent migration paths or movement between regions. This information is important when studying breeding patterns or tracking the spread of diseases, parasites, or how changes in movement may affect other species.
Graphs are also commonly used in molecular biology and genomics to model and analyze data sets with complex interrelations. For example, graph methods are often used to «cluster» cells into cell types in single-cell transcriptome analysis . Another use is modeling genes or proteins in a pathway and studying the relationships between them, such as metabolic pathways and gene regulatory networks . Evolutionary trees, ecological networks, and the hierarchical clustering of gene expression patterns are also represented as graph structures. Graph-based methods are widely used by researchers in some areas of biology, and they will become much more widespread as technologies allowing this kind of high-dimensional data develop.
Graph theory is also used in connectomics ; the nervous system can be regarded as a graph, where the nodes are neurons and the edges are the connections between them.
In mathematics, graphs are useful in geometry and certain parts of topology, such as knot theory . Algebraic graph theory is closely related to group theory . Algebraic graph theory has been applied in many areas, including dynamical systems and complexity.
In communication and transport systems. In particular, for routing data on the Internet. Searching for the minimum path to bypass given cities
Circuit design, microelectronics
The structure of a graph can be extended by assigning a weight to each edge of the graph. Graphs with weights, or weighted graphs, are used to represent structures in which pairwise connections have some numerical values. For example, if a graph represents a road network, the weights may represent the length of each road. Several weights may be associated with each edge, including distance (as in the previous example), travel time, or monetary cost. Such weighted graphs are commonly used for GPS programming and travel-planning search engines that compare flight times and costs.
Graphs are represented visually by drawing a dot or circle for each vertex and drawing a line between two vertices if they are connected by an edge. If the graph is directed, the direction is indicated by an arrow.
The drawing of a graph should not be confused with the graph itself (the abstract, non-visual structure), since there are several ways to structure the drawing of a graph. All that matters is which vertices are connected to which others by how many edges, and not the exact layout. In practice it is often difficult to decide whether two drawings represent the same graph. Depending on the problem domain, some layouts may be better suited and more understandable than others.
The pioneering work of W. T. Tutte had a great influence on the topic of graph drawing. Among other achievements, he introduced the use of linear-algebra methods to obtain graph drawings.
It can also be said that graph drawing encompasses problems related to the crossing number and its various generalizations. The crossing number of a graph is the minimum number of crossings between edges that a drawing of the graph in the plane must contain. For a planar graph, the crossing number is by definition zero.
Drawings on surfaces other than the plane are also studied.
There are various ways of storing graphs in a computer system. The data structure used depends both on the structure of the graph and on the algorithm used to manipulate the graph. In theory one can distinguish between list and matrix structures, but in specific applications the best structure is often a combination of both. List structures are often preferred for sparse graphs, since they require less memory. Matrix structures, on the other hand, provide faster access for some applications, but can consume enormous amounts of memory. Implementations of sparse matrix structures that are efficient on modern parallel computer architectures are the subject of ongoing research.
List structures include the incidence list , an array of pairs of vertices, and the adjacency list , which separately lists the neighbors of each vertex: similar to the incidence list, each vertex has a list of the vertices to which it is adjacent.
Matrix structures include the incidence matrix , a matrix of zeros and ones whose rows represent the vertices and whose columns represent the edges, and the adjacency matrix , in which both the rows and the columns are indexed by vertices. In both cases, a 1 indicates two adjacent objects, and a 0 indicates two non-adjacent objects. The degree matrix shows the degrees of the vertices. The Laplacian matrix is a modified form of the adjacency matrix that incorporates information about the degrees of the vertices, and is useful in some computations, such as Kirchhoff's theorem on the number of spanning trees of a graph. In the distance matrix, as in the adjacency matrix, the rows and columns are indexed by vertices, but instead of containing a 0 or 1 in each cell, it contains the length of the shortest path between the two vertices.
There is an extensive literature on graph enumeration : the problem of counting graphs satisfying given conditions. Some of these works can be found in Harary and Palmer (1973).
A common problem, called the subgraph isomorphism problem , consists of finding a fixed graph as a subgraph in a given graph. One reason to be interested in such a question is that many properties of graphs are hereditary for subgraphs, which means that a graph has the property if and only if all subgraphs have it too. Unfortunately, finding maximal subgraphs of a certain type is often an NP-complete problem . For example:
One particular case of subgraph isomorphism is the graph isomorphism problem . It asks whether two graphs are isomorphic. It is not known whether this problem is NP-complete and whether it can be solved in polynomial time.
A similar problem is finding induced subgraphs in a given graph. Again, some important properties of a graph are hereditary with respect to induced subgraphs, which means that a graph has the property if and only if all induced subgraphs have it too. Finding maximal induced subgraphs of a certain type is also often NP-complete. For example:
Yet another such problem, the minor containment problem, is to find a fixed graph as a minor of a given graph. A minor or subcontraction of a graph is any graph obtained by taking a subgraph and contracting some (or none) of its edges. Many properties of a graph are hereditary for minors, which means that a graph has the property if and only if all its minors have it. For example, Wagner's theorem states:
A similar problem, the subdivision containment problem, is to find a fixed graph as a subdivision of a given graph. A subdivision or homeomorphism of a graph is any graph obtained by subdividing some (or none) of its edges. Subdivision containment is related to graph properties such as planarity . For example, Kuratowski's theorem states:
Another subdivision containment problem is the Kelmans–Seymour conjecture :
Another class of problems concerns the extent to which various kinds and generalizations of graphs are determined by their vertex-deleted subgraphs . For example:
Many problems and theorems of graph theory are related to various ways of coloring graphs. Usually one needs to color a graph so that no two adjacent vertices are the same color, or with other similar constraints. One can also consider coloring the edges (possibly so that no two coincident edges are the same color) or other variants. Among the well-known results and conjectures on graph coloring, the following can be singled out:
Constraint-modeling theories concern families of directed graphs related by a partial order . In these applications, graphs are ordered by specificity, meaning that more constrained graphs - which are more specific and therefore contain a greater amount of information - are subsumed by more general ones. Operations between graphs include evaluating the direction of the subsumption relation between two graphs, if any, and computing the unification of graphs. The unification of two argument graphs is defined as the most general graph (or its computation) that is consistent with (i.e., contains all the information of) the inputs, if such a graph exists; efficient unification algorithms are known.
For constraint frameworks that are strictly compositional , graph unification is a sufficient satisfiability and combining function. Well-known applications include automated theorem proving and modeling the development of linguistic structure .
There are many problems arising, in particular, from applications related to various notions of flows in networks , for example:
Covering problems in graphs may relate to various set-covering tasks on subsets of vertices/subgraphs.
Decomposition, defined as a partition of the edge set of a graph (with the necessary number of vertices accompanying the edges of each part of the partition), gives rise to a wide range of questions. It is often required to partition a graph into subgraphs isomorphic to a fixed graph; for example, decomposing a complete graph into Hamiltonian cycles. Other problems specify a family of graphs into which a given graph is to be decomposed, for example, a family of cycles, or the decomposition of a complete graph K n into n - 1 given trees having respectively 1, 2, 3, ... , n - 1 edges.
Some specific decomposition problems that have been studied include:
Many problems concern describing the members of various classes of graphs. Below are some examples of such questions:
When depicting graphs in drawings, the following system of notation is most often used: the vertices of the graph are depicted by dots or, when the meaning of the vertex is made concrete, by rectangles, ovals, etc., where the meaning of the vertex is revealed inside the figure (graphs of algorithm flowcharts). If there is an edge between vertices, then the corresponding dots (figures) are connected by a line or arc. In the case of a directed graph, the arcs are replaced by arrows, which explicitly indicate the direction of the edge. Sometimes explanatory labels revealing the meaning of the edge are placed next to it, for example, in the transition graphs of finite automata. A distinction is made between planar and non-planar graphs. A planar graph — is a graph that can be depicted in a drawing (plane) without edges crossing (the simplest — a triangle or a pair of connected vertices), otherwise the graph is non-planar. In the case where a graph contains no cycles (containing at least one path of a single traversal of edges and vertices with a return to the starting vertex), it is customary to call it a «tree». Important types of trees in graph theory — are binary trees, where each vertex has one incoming edge and exactly two outgoing ones, or is terminal — having no outgoing edges, and contains one root vertex into which there is no incoming edge.
The depiction of a graph should not be confused with the graph itself (the abstract structure), since more than one graphical representation can be associated with a single graph. The depiction is intended only to show which pairs of vertices are connected by edges and which — are not. Often in practice it is difficult to answer the question of whether two depictions are models of the same graph or not (in other words, whether the graphs corresponding to the depictions are isomorphic). Depending on the task, some depictions may give a more illustrative picture than others.
Graph theory also includes a whole range of mathematical problems that are unsolved to this day.
продолжение следует...
Часть 1 Graph and graph theory: history, classification, description, applications
Часть 2 Connectivity in graphs - Graph and graph theory: history, classification,

Comments