
Lecture
Modern web applications typically consist of several layers: client-side logic, a web framework, business logic, an ORM technology and a database. For example, a specific stack might include Vue.js, ASP.NET WebAPI, C#, Entity Framework, MSSQL, or React.js, ASP.NET Core, NHibernate, C#, PostgreSQL. If an application lags during operation, performance problems may be hidden at one particular layer or at several layers simultaneously.
Imagine that loading a page with a large number of reports takes 5 seconds. Such a delay can be caused by a combination of miscalculations: the table in the MS SQL database is missing a necessary index; Entity Framework loads all records from the reports table into memory because the IEnumerable interface is used; the business logic, while performing additional data transformations, mindlessly allocates tons of objects (for example, as a result of active string modification or frequent List’s resizes), and multi-megabyte .js and .css files are sent to the client unminified. Fixing only one of the listed points will not be enough to achieve maximum performance of the application as a whole. Diagnosing performance problems, eliminating them and preventing them requires comprehensive work.
Studies by respected companies show that an extra 100 ms of delay noticeably drags down product metrics — and the negative effect becomes more and more noticeable over time.
According to Amazon’s data:
10 years ago, every 100 ms of delay dropped conversion by 1%;
5 years ago, every 100 ms of delay was already dropping sales by 7%.
Google says:
15 years ago, an extra 400 ms of delay reduced traffic by 20%;
5 years ago, when Largest Contentful Paint (LCP) decreased by 300 ms, this gave +12% engagement and +9% views.
Deloitte states that speeding up page load time by 100 ms can increase conversion by 8%.
Just a tenth of a second — and results like that. But let’s look at what those 100 ms mean from a cognitive point of view:
in 13 ms the human brain is able to catch an image, meaning that at an FPS below 77 you can notice the “25th frame effect”;
in 100 ms — make out what the image means;
in 150 ms (on average) — process the image and react somehow;
in 17–50 ms the brain is able to form an aesthetic reaction to a web page, according to YouTube UX researchers.
In this article, let’s agree that “fast” means less than 100 ms.
In website-building recommendations, 100 ms is a good value for the interactivity metric. But some other figures are still measured in seconds, meaning that in the real world content loads for whole seconds. We are all far from the 100 ms ideal, and there is still a lot of work ahead of us.
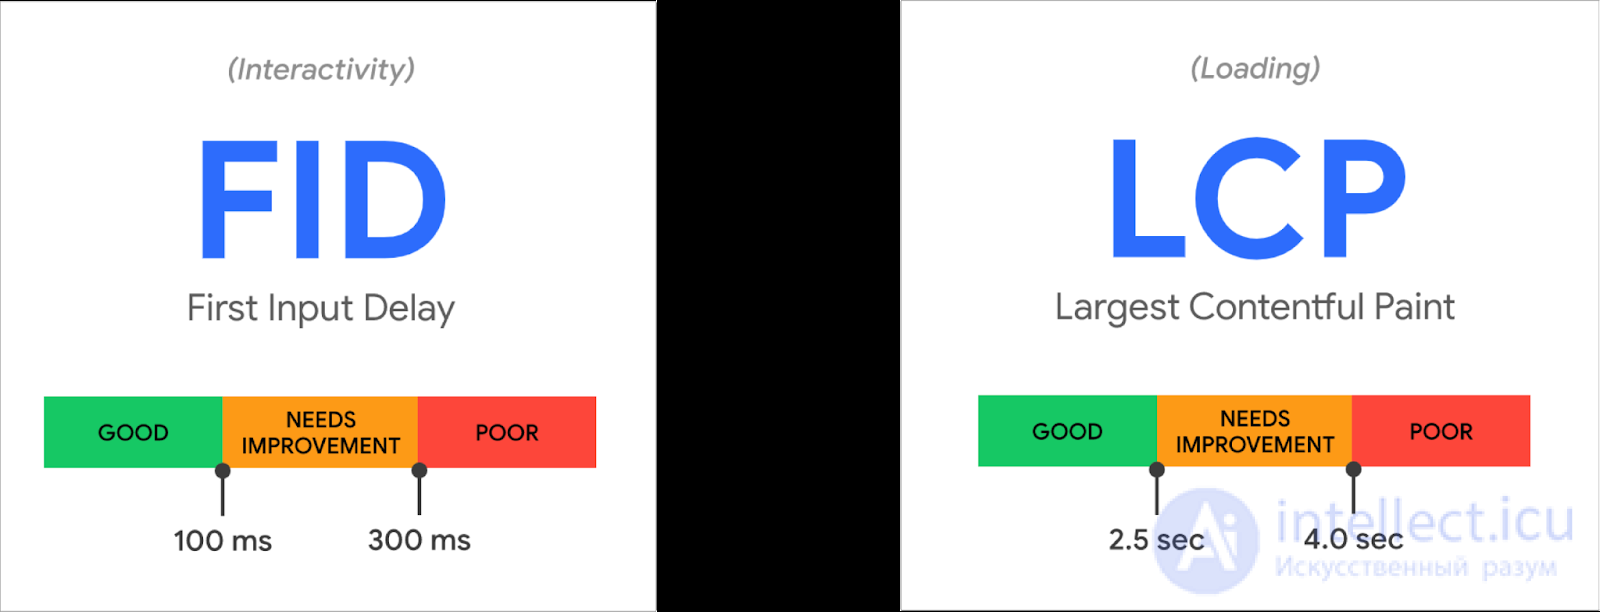
https://web.dev/vitals/
Of course, at VKontakte we too fight for every 100 ms of content delivery, page rendering, application startup and other operations.
To understand where the maximum effect can be achieved, let’s recall how almost all internet services are structured. At a basic level, they can be described roughly like this:
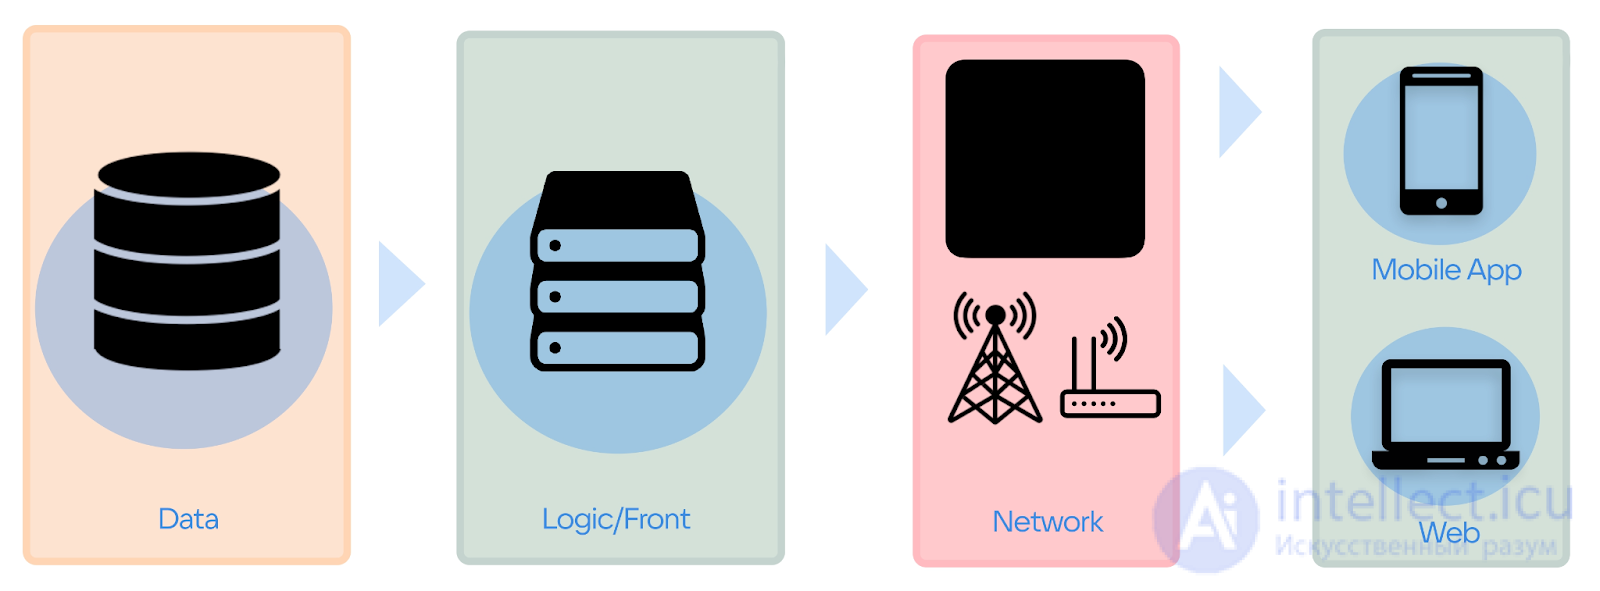
At the logic and client layer, an internet service can work very fast if you’ve written good code — that’s why the blocks are highlighted in green on the diagram. The speed of accessing RAM or an SSD depends directly on the quality of the code: it is in your power, and it can be optimized by understandable means.
Working with data is usually a bit slower, but databases and storage systems are becoming ever more efficient at disk access, caching and so on. So the block is orange: with reasonable effort, latency here is on the order of 10–30 ms and fairly predictable.
The slowest and hardest layer to optimize is the network layer. Developers rarely get to it: to optimize anything at the network layer, you need to optimize both the backend and the client — and roll it out at the same time.
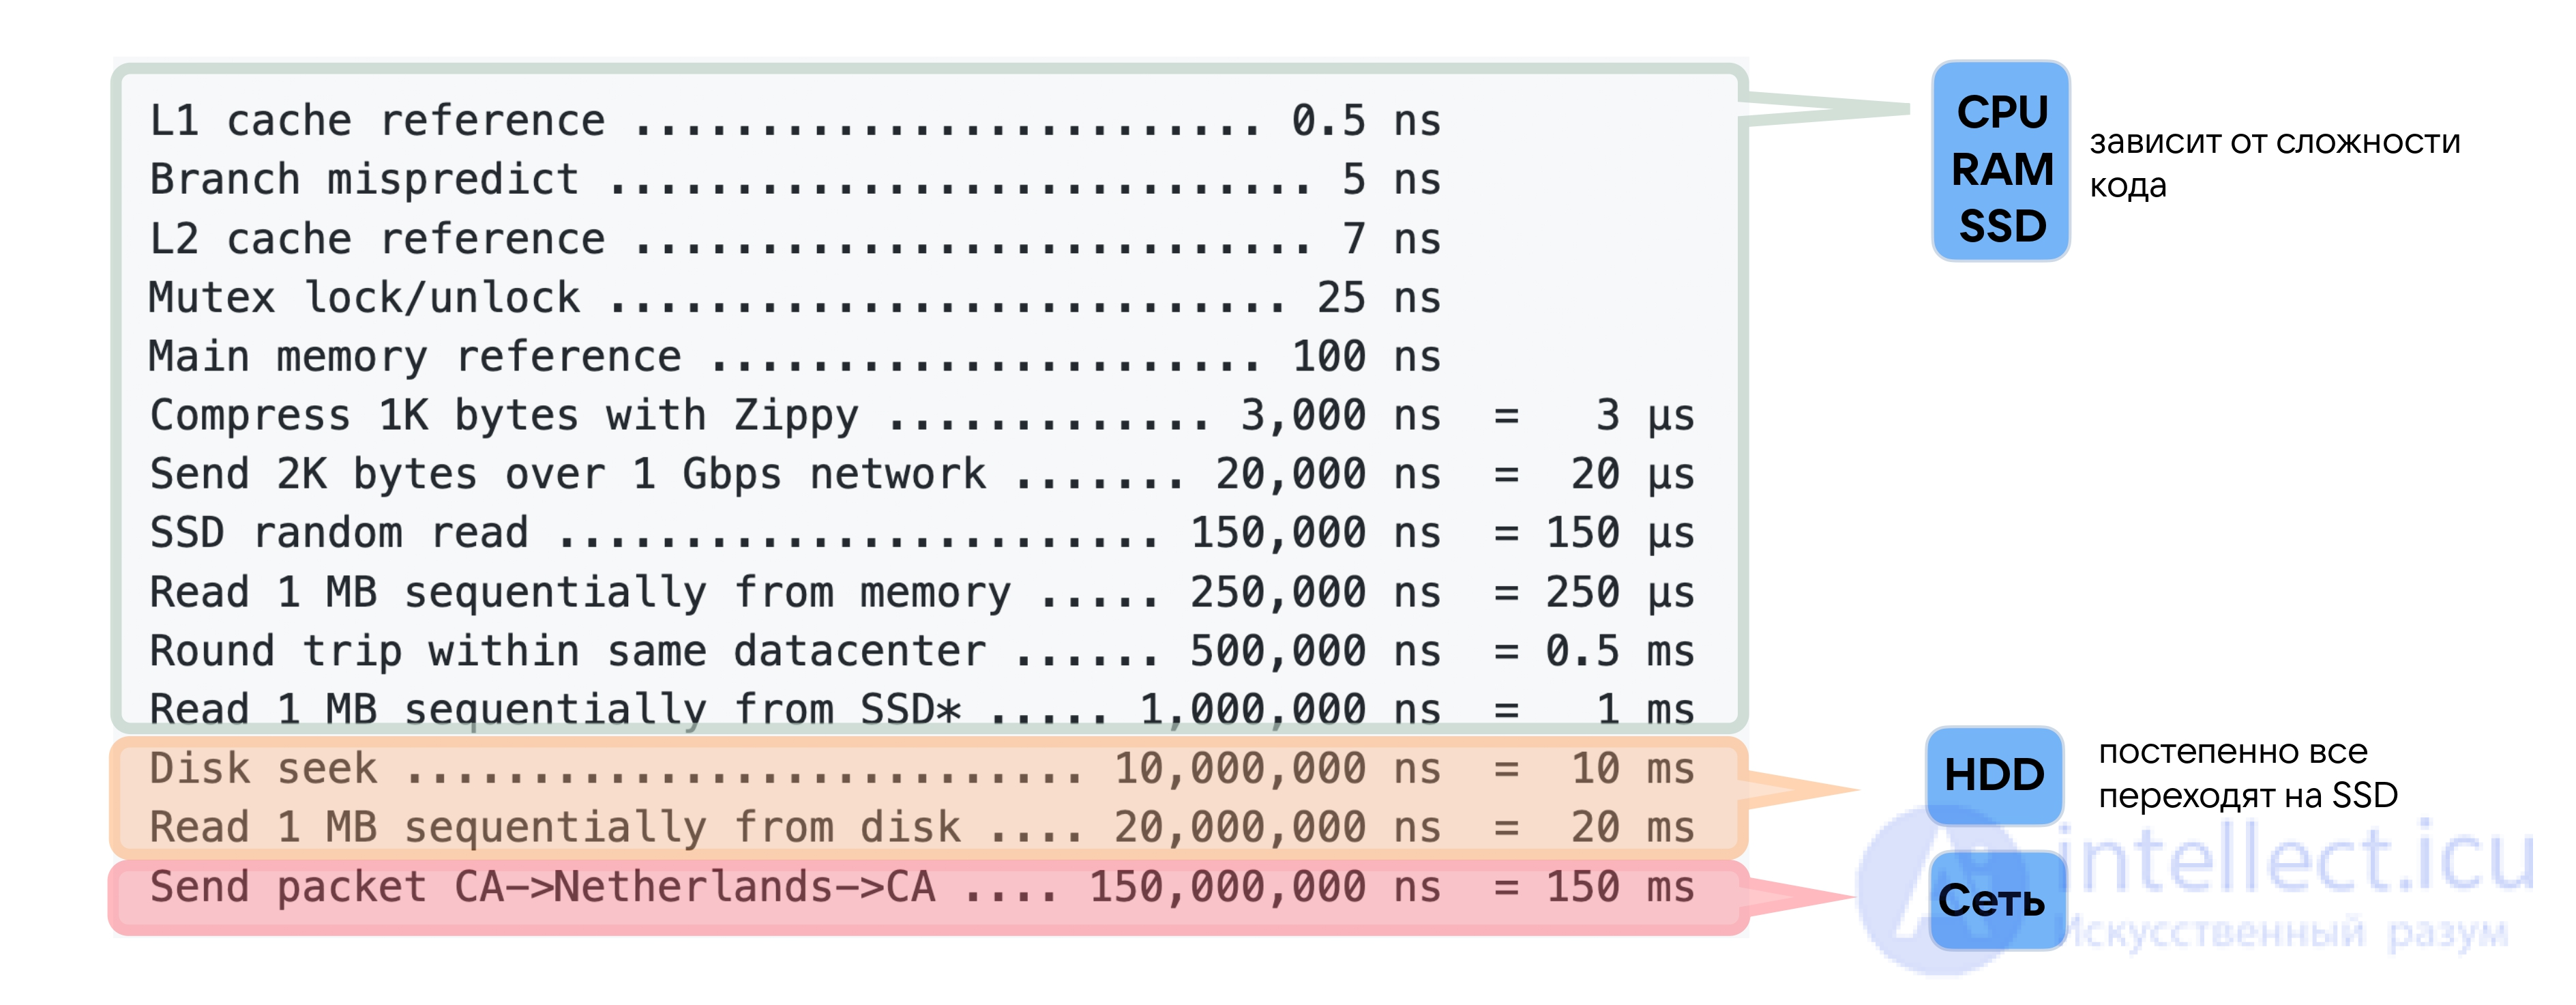
At the same time, in “Latency numbers every programmer should know”, the network is allotted far more than all other operations combined — 150 ms. 150 ms is what every round-trip to another continent costs. If your users and servers are on different continents, then the latency of your entire service is definitely more than 150 ms. As we found out, that already creates the feeling that something is lagging.
We remember that “premature optimization is the root of all evil”. Before optimizing, you need to stop and think: why speed anything up at all, if over the last 20 years internet network bandwidth has grown 1,000-fold.
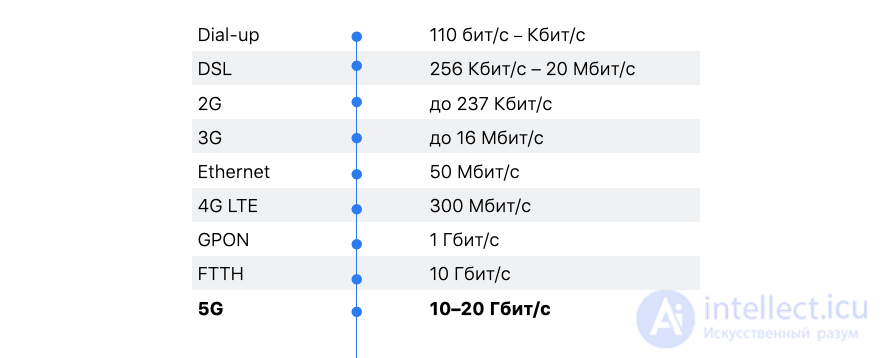
All that is true. But let’s look at how other network characteristics have changed recently, in particular round-trip time (RTT).
The image below shows the main ways to fight performance degradation at each layer of the application. Most of the recommendations given do not relate to a specific technology or its version.

Reducing the number of requests to the server. If displaying a given page executes a large number of requests to the server and the total load time is long, several actions can be taken. First, the responses of individual requests can be cached. Second, the list of requests executed within the page can be reviewed. Some requests may no longer be relevant, i.e. the client executes a request but does not process the response. Requests may also be duplicated. Such surprises are often found in large systems developed by a large distributed team, where requirements from the customer often change, leaving junk in the code as a result. Third, a page does not always need to wait for absolutely all requests to finish before the user can start working with it. It is enough to wait for the requests that return the main content or prepare key functionality, and load the rest asynchronously.
To diagnose the problems described above, the Network tab in Chrome DevTools is usually enough — there you can examine the number of requests executed, their time, content, size, etc.
Reducing the number of DOM accesses. JavaScript and the DOM are two separate technologies. JavaScript works with the DOM through an API, which entails additional overhead. Modifications to DOM model objects entail execution of the heavy browser operation Reflow, whose execution time grows with the number of tags on the page, the nesting level of tags and the number of CSS styles.
If there is a need to work with the DOM directly, bypassing the JS framework, then references to DOM objects can be cached and reused. Also, a large number of DOM-object updates can be performed in a “detached” mode (on a copy of the real DOM object in RAM, whose changes do not affect the UI), after which all the changes made are applied to the UI at once.
The problem of frequent DOM manipulation can be diagnosed using the profiler found in the Performance tab of Chrome DevTools.
Good knowledge of the JS framework. Synchronizing JS models and the DOM is the main responsibility of JS frameworks, which they perform quite quickly. However, as the volume of data grows, the speed of synchronizing the DOM and the JS model when changes are made to the latter can slow down to an unacceptable level. To fix such a problem, superficial knowledge of the JS framework at the “how to bind a model to the UI” level is no longer enough.
In the documentation of every JS framework you can find ways to optimize its performance. For example, in React.js, shouldComponentUpdate() is used to avoid unnecessary rendering, while in Knockout.js the valueHasMutated() method helps avoid performance problems with frequent modification of a model bound to the UI, and so on.
Switching to the HTTP/2 protocol. A simple switch from the HTTP/1.1 protocol to HTTP/2.0 can increase site speed, since the new version of the protocol supports making multiple requests to the server within a single TCP connection, uses a compression mechanism for HTTP headers, and prioritizes requests, delivering more important content to the client faster.
HTTP/2 is supported by most modern browsers, and no configuration is required on the client side. On the web-server side, IIS or Kestrel require manual configuration. In the Network tab of Chrome DevTools you can check which protocol the client and server communicate over.
Asynchronous loading of JS files. The browser renders the page by reading the HTML code. If the browser encounters a script tag, page rendering is paused until the JS file, along with all its possible dependencies and server requests, is fully loaded. The async attribute on the script tag will make the browser not pause page rendering, so the page will be shown to the user much faster.
With proper design, page rendering is blocked only until the key content or functionality that the user is most likely to work with right away, and without which the page makes no sense, has fully loaded. Loading of auxiliary parts of the page is performed asynchronously.
Using asynchronous image decoding
sync: Decode the image synchronously, to be displayed at the same time as other content.async: Decode the content asynchronously to reduce the delay in displaying other content.auto: The default mode, which does not favor either decoding mode, letting the browser decide which mode is more optimal for the user
Using responsive image versions
The HTML picture element serves as a container for one or more  elements and one img element, to provide the optimal image version for different screen sizes. The browser will examine each of the child elements
and choose the one matching the best fit; if no match is found among the elements
then the file specified by the src attribute of the img element will be chosen. The selected image is then displayed in the space occupied by the img element.
Optimizing heavy server responses. Server responses of hundreds of kilobytes take a noticeable amount of time for the browser to load. Such responses can be compressed with standard gzip, which can be achieved by adding an attribute above the GET request declaration. No code needs to be written on the client side, since browsers can decompress compressed data on their own.
Performance degradation caused by heavy responses can be diagnosed in Chrome in the Network tab of DevTools. Clicking on a specific web request shows information about its size and the time the browser spent loading the response (the Content Download property).
Using OutputCache and the ETag mechanism. If the server returns heavy data that rarely changes, it can ask the browser to cache it by setting special HTTP headers. To cache static content, the OutputCache or ResponseCache attributes are usually used, specifying the time during which the browser will take data from its cache. If it is necessary to cache content with the ability to immediately refresh the cache when data changes on the server, the ETag mechanism is used.
Asynchronous invocation of blocking operations. A synchronous call to a blocking operation, such as accessing a third-party service, reading/writing data from a hard disk or a database, leads to blocking the thread that initiated that operation. The thread will wait for the blocking operation to finish and will not be able to do other work, such as processing incoming requests to the web server. As a result, you can end up with a problem where the server cannot allocate a new thread to process an incoming request, because all available threads are waiting for the synchronously called blocking operations to finish. When a thread calls a blocking operation asynchronously, it returns to the thread pool, as a result of which the server can use a minimal number of threads to process incoming requests.
Another example of using asynchrony is calling several blocking operations in a row, for example, to aggregate a data set from different sources. With a synchronous call to several blocking operations, the total execution time will equal the sum of the execution times of all the operations, while with an asynchronous call it will drop to the execution time of the single longest blocking operation.
To diagnose problems of irrational thread usage, you can use the ThreadPool class and the System.Diagnostics namespace, where you can get information about the number of threads in use at a given moment, their maximum available number, etc.
Minification of script and style files. Minification is an optimization process in which the size of .js and .css files is reduced by removing unnecessary spaces, indentation and comments, as a result of which the page load time is reduced. JS libraries are usually shipped with minified versions of files. If your own files need to be minified, some javascript-minifier can be used. Another optimization technique, Bundling, allows combining several .js or .css files into one. Bundling and Minification are enabled for production, but for the test environment minified files are not used, so as not to complicate the debugging process.
Image optimization. Reducing image size reduces page load time. Images can be optimized manually using a large number of online services or extensions, such as the Visual Studio Image Optimizer. Images can also be optimized automatically when running a build or deploying an application, using gulp-imagemin, Azure Image Optimizer and others.
Choosing the most optimal data structure. Each data structure (Stack, List, Dictionary, HashSet and others) is optimized for specific operations on it and should be chosen by the programmer based on the conditions of the task being solved. For example, a regular array is great for storing objects in a certain order, but expanding the array will be slow, since it will need to be constantly recreated, and searching for an element will be the slowest — linear. HashSet is good for fast object lookup, but the objects within the collection must be unique. If operations are frequently used on the chosen data structure for which it is not optimized, and it stores tens of thousands of objects, you get performance problems.
Cluttering memory with unneeded objects or a long execution time for a piece of code are symptoms of an incorrect choice of data structure; accordingly, memory and CPU profilers such as Visual Studio Memory Profiler, JetBrains dotTrace and ANTS Memory Profiler are suitable for diagnosing this problem.
Controlling the number of allocations. An extra allocation has two drawbacks: the allocation process itself takes some time, and it creates additional work for the garbage collector. There are many ways to get an allocation implicitly, among them boxing, working with LINQ, working with immutable objects, closures, collection overflow and so on. Profilers from the previous point can be used to control the amount of RAM used. For static code analysis for implicit allocations, Heap Allocations Viewer or the Roslyn Clr Heap Allocation Analyzer are useful.
Understanding the principles of how the garbage collector works. The fewer allocations, the lower the load on the garbage collector, and the less it slows down the application. Besides this rule, it is useful to understand how the GC works with the large object heap, weak references, and what garbage collection modes exist, in order to achieve maximum performance in a relatively short amount of time. It is also useful to understand the causes of memory leaks in managed code, and to know when to apply the Dispose pattern.
The garbage collector has various events (GCStart, GCEnd, GCAllocationTick, etc.) that you can subscribe to in order to collect information about the time and causes of GC runs, the amount of memory freed, etc. Detailed statistics on GC operation and the amount of memory used are also provided by performance counters (Time in GC, Total committed Bytes, Large Object Heap size, etc.), which can be obtained using the lightweight Performance Monitor program. For more advanced memory analysis, the Windows Debugger (WinDbg) can be used. To study the details of how the GC works and how memory is organized in .NET, there is an excellent book, Under the Hood of .NET Memory Management.
Parallelizing heavy loops. If a foreach or for loop performs tens of thousands of iterations, slowing down the application, it makes sense to use the Parallel class, provided the order in which iterations execute does not matter. If the logic of the Parallel class decides that processing the data with several threads or processors makes sense under the given conditions, the collection will be split into parts, each of which will be sent for processing to a separate thread, after which the results will be merged back into a single collection.
Caching frequently used data. This is not about caching database data using the Cache-Aside pattern or in static properties, but about maximizing the reuse of computed data. I once investigated a performance problem in report generation. Besides a number of unnecessary database calls, the profiler showed that 20% of the time was spent working with the DateTime type. It turned out that the report generation code kept calling the DateTime.Now property inside loops. Moving it outside the loops improved report generation speed by that same 20%.
Pure functions are good candidates for caching. If such a function is called many times and slows the application down, a key can be built from its input parameters and the function's return value can be cached against that key.
Using IQueryable instead of IEnumerable. Both interfaces let you filter a data collection by a given predicate. However, IEnumerable performs the filtering on the .NET side, first loading all the records out of the database. IQueryable filters the data on the SQL server side, returning only the number of records actually needed.
Debugging and optimizing LINQ queries. The developer writes a LINQ query, the ORM translates it into SQL and passes it to the SQL server for execution. The generated queries are not always the most optimal. You need to keep track of everything the ORM sends to the SQL server and, if necessary, rewrite the source LINQ to improve the resulting SQL. If rewriting the LINQ doesn't help, you can abandon it in favor of writing the SQL query directly in the C# code, or use stored procedures.
Starting with Entity Framework 6.0, SQL queries can easily be tracked using the context.Database.Log property. You can also use an SQL profiler, an Entity Framework profiler, or simply call IQueryable.ToString().
Fetching the minimum necessary data set. You should extract no more data from the database than is required for the web request to succeed. The more you extract, the worse the performance. Excess data can be pulled in when:
Using the AsNoTracking and CompileQuery methods. Using the AsNoTracking method in Entity Framework helps improve performance in cases where a large read-only collection of objects is retrieved from the database. Entity Framework does not cache such objects in the DbContext and stops tracking changes to them. Entity Framework Core added the ability to force the entire DbContext to work in read-only mode by setting the QueryTrackingBehavior property.
The CompileQuery and CompileQueryAsync methods help improve performance in cases where a certain LINQ query is invoked repeatedly. Instead of constantly compiling the LINQ query into SQL before every execution, it is compiled once for the lifetime of the web request or the entire application. Moreover, a compiled query does not need to be recompiled when the input parameters change.
Avoiding the N+1 problem. For good performance, the number of queries to the SQL server should be minimal, but the N+1 problem instead causes it to grow. For example, there is a List collection of objects, the Country class contains a List property with lazy loading enabled. When iterating over the List and accessing the List property in the loop, you get one query to the database on every iteration.
The N+1 problem can be tracked down using an SQL profiler. Usually it shows identical SQL queries, one after another, with different parameters. In Entity Framework the problem is solved by preloading the data with the Include method (Eager Loading).
Creating and maintaining indexes. Indexes are created for one or more table columns that are most frequently used for data lookups. The speed of a query, for example SELECT * FROM Info i WHERE i.SomeID = 10, on a table with a hundred thousand records will differ dramatically depending on whether an index exists for the SomeID column. However, having a large number of indexes on a table will slow performance down, since indexes have to be rebuilt whenever the table's data is updated, plus extra memory is required to store them.
Whether queries use the indexes can be understood by analyzing the results of the SQL Server Query Execution Plan. Statistics on index usage are provided by the MS SQL function sys.dm_db_index_operational_stats.
Fetching the minimum necessary data set. To minimize the data retrieved, keep an eye on the number of columns listed in the SELECT statement, use SET NOCOUNT ON in stored procedures, use ‘SELECT 1 …’ instead of ‘SELECT * …’ to check whether records exist in a table, and use the “narrowest” predicates possible in WHERE (ones that don't return extra rows, only the ones needed).
Using the smallest data type for columns. Memory used by the SQL server can be significantly saved if, when designing tables, you choose the smallest data types for the columns. Before choosing a data type for a column, it's not enough to know whether it will store a string or a number. You need to think about the range of allowed values. For example, there's no point using bigint or int to store a person's age. A tinyint with a range from 0 to 255 will do the job. Optimizing table size, besides saving memory, will also increase the speed of JOINs and speed up index scans.
Lowering the isolation level. Because several transactions access MS SQL tables at the same time, locks can occur that reduce the expected query execution time. Lock problems are primarily solved by optimizing SELECTs, which helps lock less data for less time. In other cases you can consider lowering the transaction isolation level, all the way down to READ UNCOMMITTED, or using the SNAPSHOT ISOLATION level, which solves concurrent access problems through versioning instead of locking. You can also use the WITH (NOLOCK) option, which works similarly to the READ UNCOMMITTED level but is applied not at the transaction level but to an individual SELECT.
Lock problems in MS SQL can be diagnosed using the Activity Monitor utility.
Denormalizing rarely changed data. Normalized data is optimized for fast, convenient updates, denormalized data — for reading. The price of normalization is poor read speed due to frequent JOINs and aggregate function calls; the price of denormalization is high complexity of updating the data and keeping it in a consistent state.
If the data in a certain table rarely changes and at the same time it is often involved in JOINs, it makes sense to merge that table with the others. If the entire database gradually turns denormalized and the complexity of keeping the data in a consistent state goes off the scale, you can consider the CQRS approach at the database level, in which a fully normalized database is used for writing data, and a maximally denormalized one — for reading.
Applying heavily denormalized databases of the NoSQL type

transferring data in a REST API JSON/XML MessagePack more advanced ways of transferring data using neural networks or other non-standard methods or communication channels
JSON is, of course, very convenient and human-readable, but there are more modern solutions, for example: BSON, CBOR, MessagePack.
We set the following requirements for the new data representation format:
binary;
fast (with Zero-copy support);
schemaless;
supports the types that exist in JSON for conversion.
MessagePack, sped up by 50% relative to JSON,
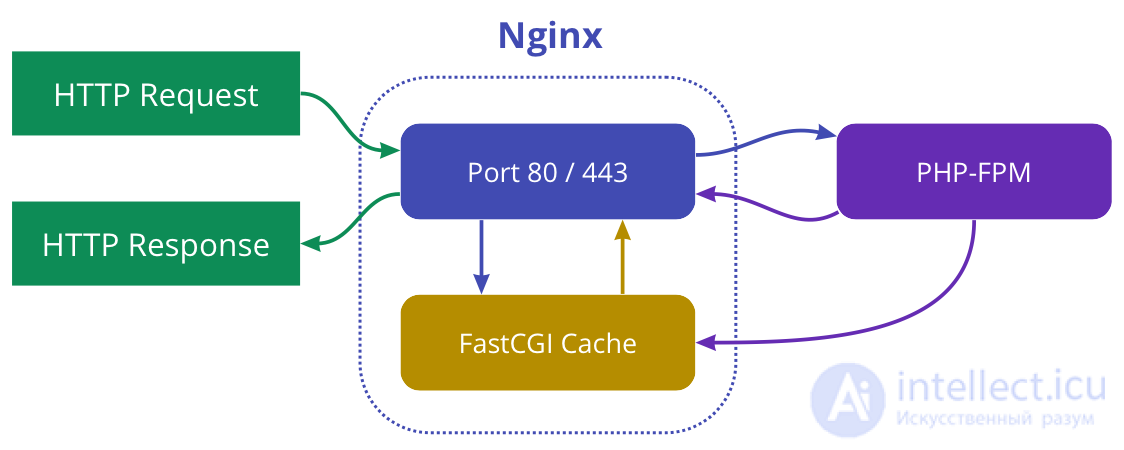
FastCGI Cache is a data caching system implemented at the level of the Nginx HTTP server.
The advantage of FastCGI Cache is that Nginx returns the cached response to the user immediately upon receiving the request, while the application layer does not process the incoming HTTP request at all if it is present in the Nginx cache.
Using FastCGI Cache is an excellent way to reduce the load on your system.
If your site has pages that change rarely, or where a delay in updating the information for some time is not critical, then FastCGI Cache is exactly what you need.
If an HTTP request arrives at the Nginx server and the response to the same request was placed in the cache some time ago, Nginx will not pass this request on to PHP-FPM for execution; instead Nginx will return the result from the cache.
Object caching can seriously improve the performance of your WordPress site by optimizing the database query process, but serving a page request still incurs a lot of overhead because the server is needed for PHP processing.
This overhead is caused by the fact that WordPress and PHP have to build the requested HTML page on every page load. We can reduce this drain on server resources by caching the HTML version of the requested page after it's generated, and then, on the next request for that page, we simply serve the cached HTML page and can bypass WordPress or PHP entirely.
This type of static page caching is especially useful on sites where the content of each page is updated rarely.
However, there are various options for caching a static page, so let's first look at our options.
Varnish Cache is a well-established web application accelerator, also known as a caching HTTP reverse proxy. Essentially, you install it in front of any server (in our case NGINX) that supports HTTP, and it will cache the returned content of any page requests.
It really is very fast.
The reason I decided to use NGINX FastCGI caching instead of Varnish caching in this series is that Varnish does not support the HTTPS protocol, while NGINX FastCGI caching works about as fast.
Our WordPress site was configured to use Let's Encrypt SSL, in order to take advantage of HTTP2, which is only available over HTTPS. Consequently, to use the Varnish cache, we would need an HTTP terminator sitting in front of it to intercept and decrypt HTTPS page requests on port 443 before passing them on to the Varnish cache. We could use NGINX for this purpose, but we have to ask whether the added complexity is worth it.
Here are two diagrams that clearly illustrate why I decided to go with NGINX FastCGI caching instead of Varnish caching:
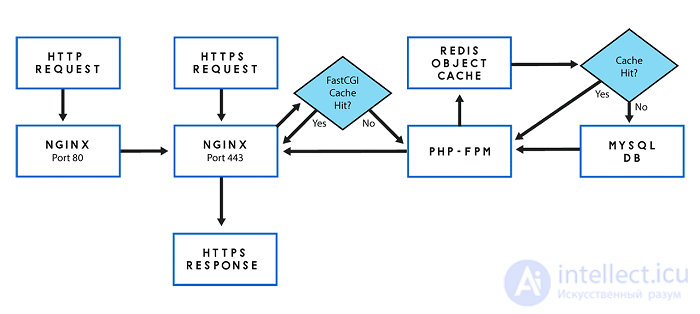
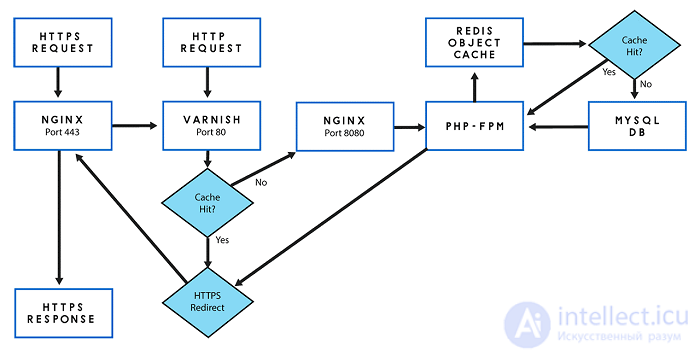
The increased complexity is clearly visible. Adding another component to our stack represents another possible point of failure and increases the administration and configuration burden.
Another alternative to NGINX FastCGI caching is using one of the many WordPress static caching plugins.
The most well-known of these, WP Super Cache, is made by Automattic itself. This plugin will generate static html files from your dynamic WordPress site and cache them in the WordPress directory. When a visitor visits your site, your server will serve that file instead of processing the comparatively heavier and more expensive WordPress PHP scripts.
Such plugins have many settings. With more advanced configuration, they can offer similar improvements, bypassing PHP entirely. However, this advanced configuration relies on an Apache module, and since our stack uses the more performant NGINX web server, we would need to use non-standard configurations that are harder to debug.
The simpler configuration recommended by the plugin actually serves static HTML files through PHP, which is exactly what we want to avoid.
In addition, these plugins require PHP and WordPress to be running in order to serve any pages. One of the benefits of NGINX FastCGI caching is that it can be configured to keep serving pages even if PHP (and therefore WordPress) fails.
For the reasons above, I decided to use NGINX FastCGI caching.
Now that we have Redis object caching and NGINX FastCGI static page caching enabled, it's time to go back to load testing and server monitoring.
Log in to your New Relic Infrastructure dashboard and to Loader.io to start load testing and monitoring.
1000 users per minute with caching enabled
Since we know that without caching our server's CPU really started to feel the load at 1000 users per minute, let's start load testing with that setting.

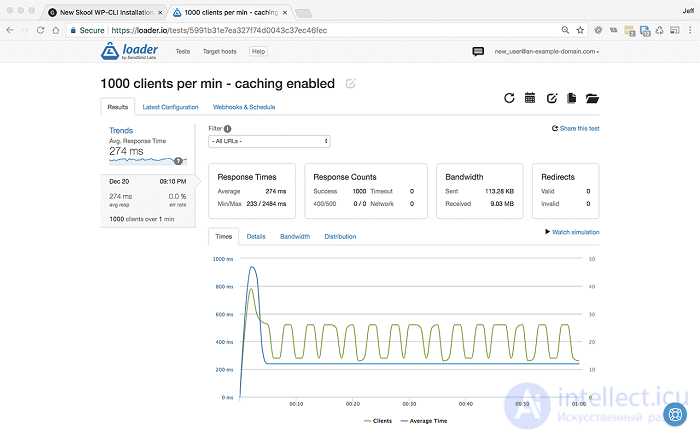
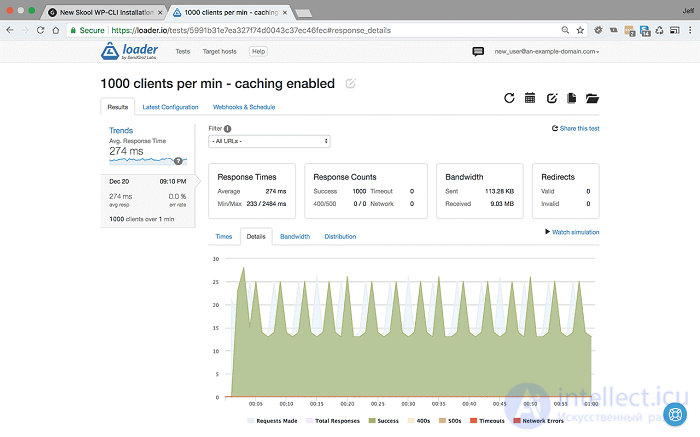
<1000 users per minute for 1 minute with caching enabled - Settings and results>
As we can see, at 1000 users per minute we reduced the response time from 338 ms to 274 ms, which is a great start, but let's look at CPU usage in New Relic:
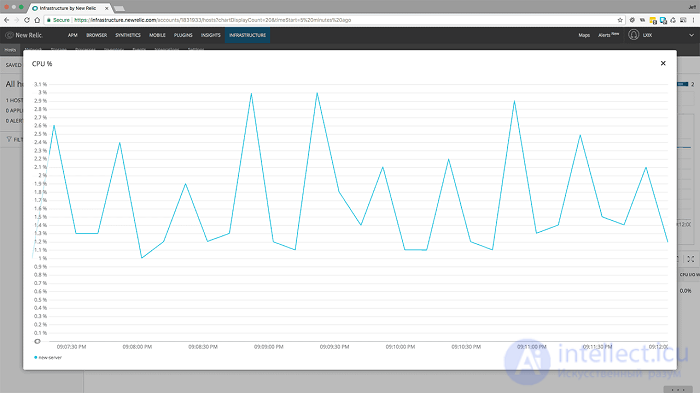
<1000 users per minute for 1 minute with caching enabled - CPU load>
Here we see the real benefit of caching. Without caching, CPU load rose to 24%, but now that we have caching enabled, you can see that CPU load stays stable at 2-3%. That's an incredible difference.
5000 users per minute with caching enabled.

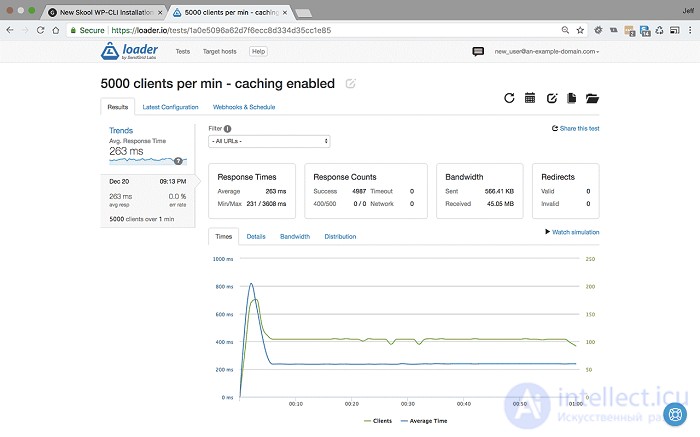
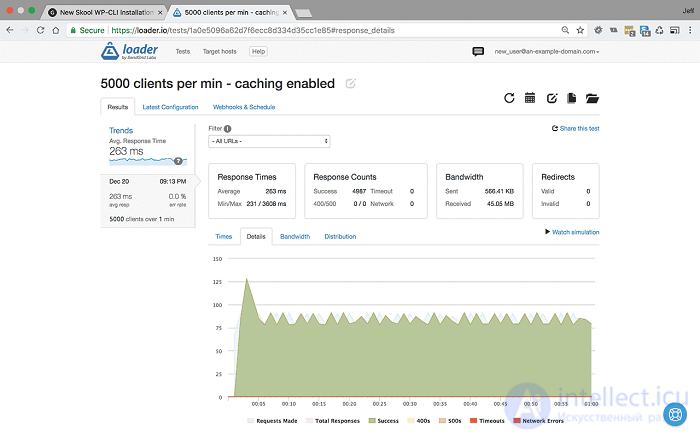
<5000 users per minute for 1 minute with caching enabled - Settings and results>
At 5000 users per minute without caching, response time dropped to 1715 ms, and we started to see http 500 errors. But as you can see, with caching the average response time stays stable, and in this test it actually decreased to 263 ms, and we are still serving 100% of responses.
Let's see what picture the CPU load paints
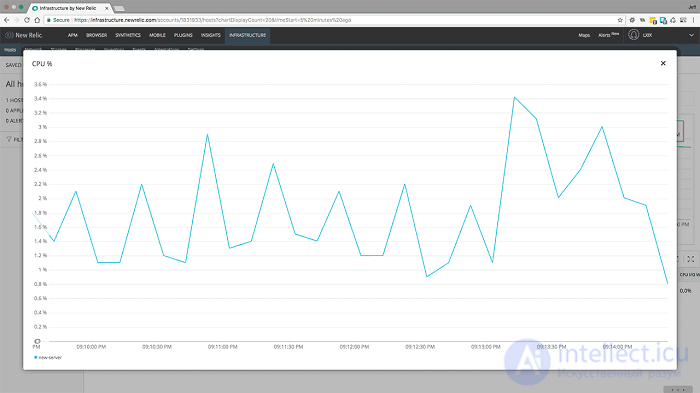
<5000 users per minute for 1 minute with caching enabled - CPU load>
Same story here. CPU usage barely changed from 1000 to 5000. It shows a slight increase to about 3.5%.
Remember that without caching our server used to run at 100%.
Earlier we estimated a rate of 7500 users per minute, but let's push the server a little harder and see what happens ...
10000 users per minute with caching enabled.

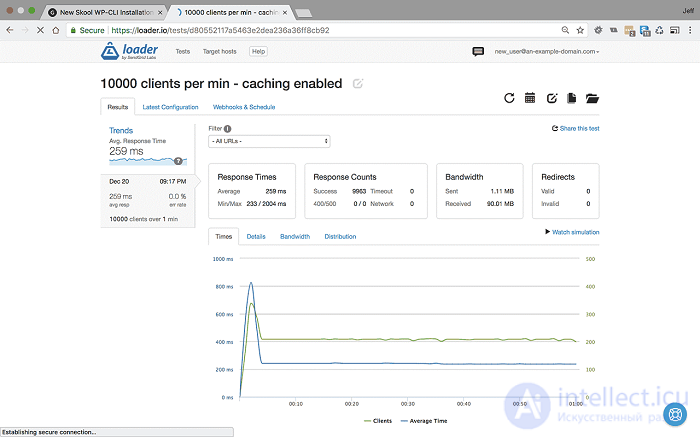
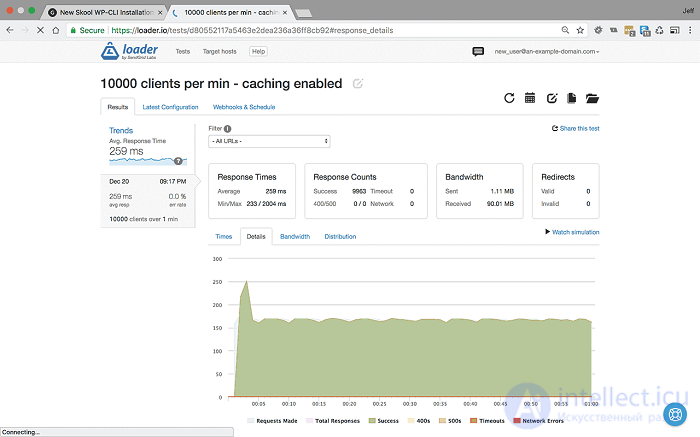
<10000 users per minute for 1 minute with caching enabled - Settings and results>
It's precisely at such high loads that our server used to give up without caching, returning an error rate of 35%. Now that caching is enabled, you can see that even at 10000 users per minute our server doesn't break a sweat, the average response time is 259 ms, and the error rate is 0%.
As for CPU usage:
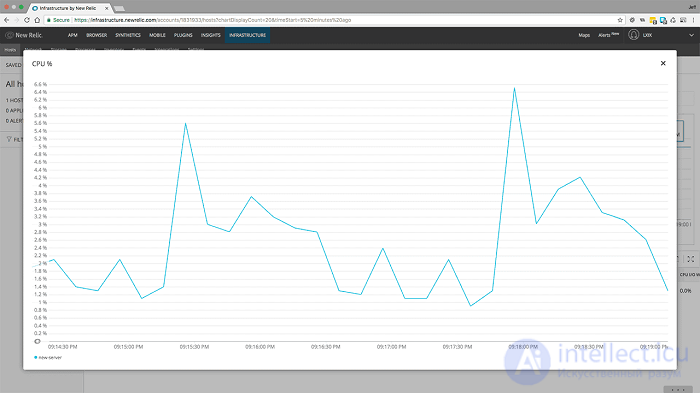
<10000 users per minute for 1 minute with caching enabled - CPU load>
CPU usage has now risen to about 6%, which is still within optimal performance range.
If we want to increase the load on the server further, we need to move to users per second.
500 users per second for one minute with caching enabled
That amounts to 30000 visitors per minute, or 1.8 million visitors per hour - on the server.

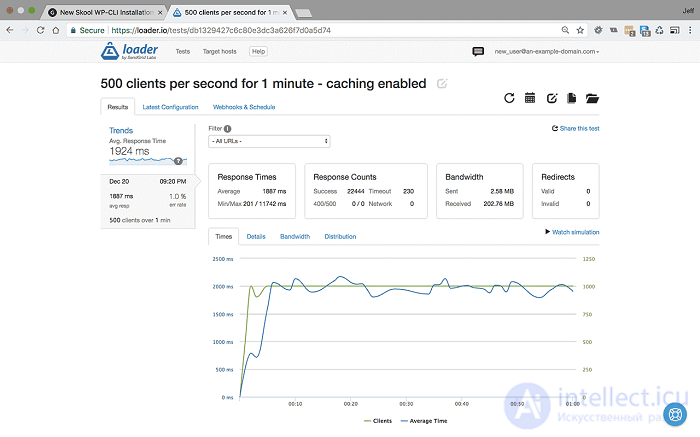
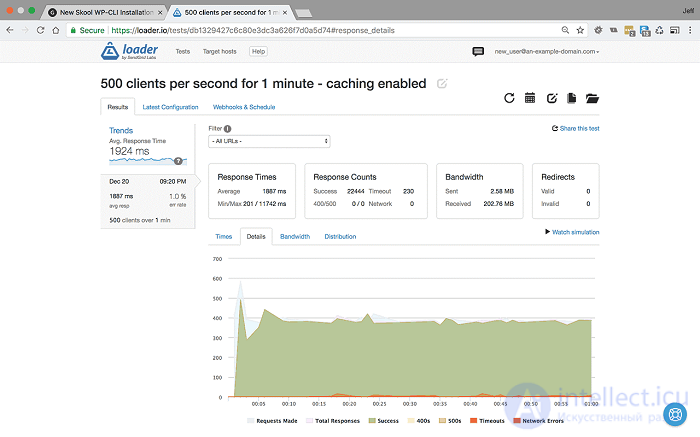
<500 users per second for 1 minute with caching enabled - Settings and results>
We see that at a rate of 500 users per second for one minute, the site starts to lag. The average response time dropped to 1887 ms, and it shows a 1% error rate, mostly due to timeouts, suggesting that the bottleneck is I/O rather than server performance.
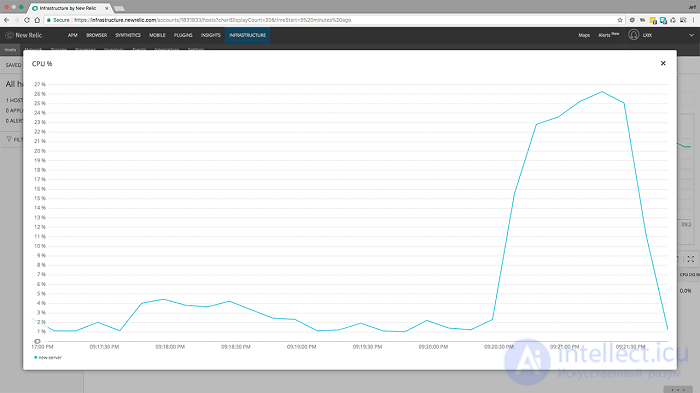
<500 users per second for 1 minute with caching enabled - CPU load>
Here we see that CPU load peaked at around 27%. This is still within an acceptable range, which adds weight to the I/O-related errors.
We've come this far, so we can push the boat out a little further while we're here ...
1000 users per second for one minute with caching enabled
(60000 visitors per minute, or 3.6 million visitors per hour!)

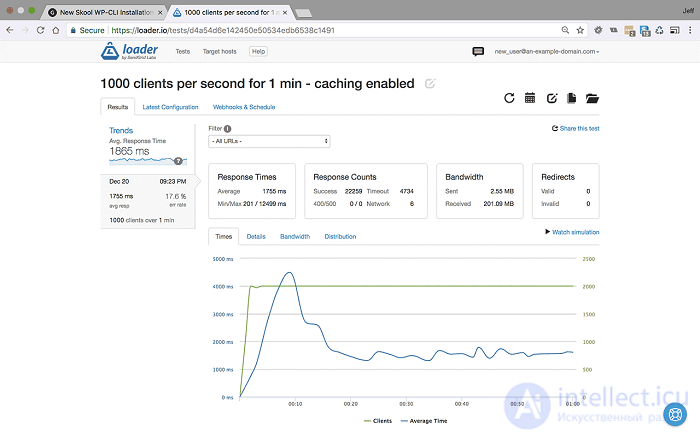
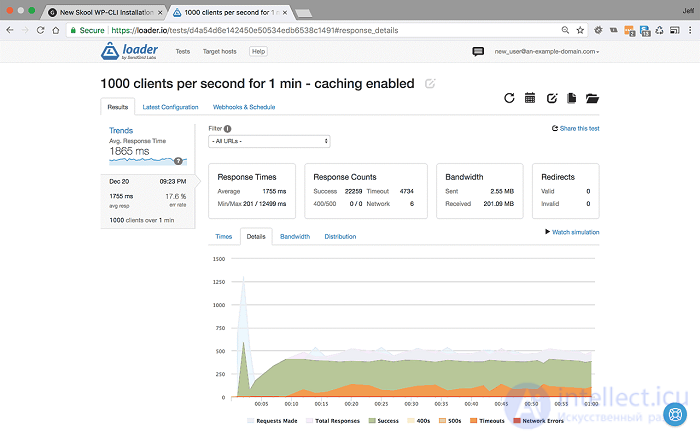
<1000 users per second for 1 minute with caching enabled - Settings and results>
We see that the average response time actually remains stable at around 1755 ms, but our error rate increased to 17.6%, mostly due to timeouts.
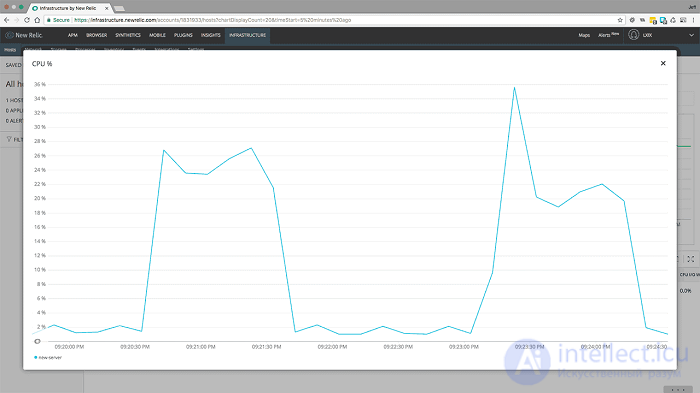
<1000 users per second CPU - caching enabled>
Interestingly, our CPU usage spikes sharply to about 36%, and then drops back down and plateaus at usage similar to 500 users per minute.
Let's look at our server's CPU usage, showing results for the server without caching and with caching enabled:
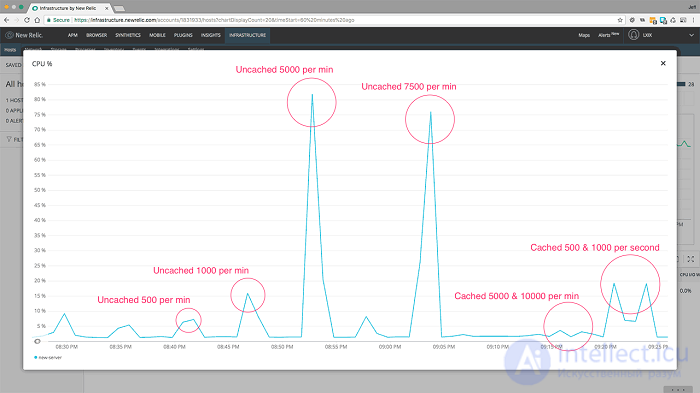
CPU usage shows both results for comparison.


Comments