
Lecture
An opinion poll, often simply called a poll or a survey (although strictly speaking, a poll is an actual election), is a human research study of public opinion from a given sample. Opinion polls are usually designed to represent the opinions of a population by conducting a series of questions and then extrapolating generalities in ratio or within confidence intervals. A person who conducts polls is called a pollster.
A sociological survey (public opinion poll) — a method of sociological research consisting in the collection and acquisition of primary empirical information about particular opinions, knowledge, and social facts constituting the subject of the study, by means of oral or written interaction between the researcher (interviewer) and a given set of those being surveyed (interviewees, respondents)
«The survey method is the most widespread of sociological methods, one that shapes the "image" of sociology in the eyes of the uninitiated and, moreover, has the richest and oldest history. The claim that it is almost impossible to give a strict and exhaustive definition of what a survey is may at first glance seem absurd. In reality, however, ideas about what a good sociological survey should be have changed so often that any attempt to reduce the definition of a survey to a specific data-collection technique, research design, type of data analysis, or manner of using the information obtained is bound to run into difficulties», ‒ I. F. Devyatko, Methods of Sociological Research, 1998.
A sociological survey is one of the most widespread ways of gathering the necessary information in modern sociology and marketing.
Modern science classifies sociological surveys according to several basic principles.
There is also a classification of social surveys by place of conduct (at home, on the street, at work, in a hospital, in places of detention, etc.). By degree of formalization, a distinction is made between free (non-directive, non-formalized), focused (semi-formalized), and fully formalized surveys — the latter being strictly aimed at obtaining specific empirical data.
Depending on exactly how the necessary information is obtained from those surveyed, a sociological survey can be direct or indirect. A direct survey (interview) takes place in a face-to-face conversation with the respondent. It is often conducted by representatives of the press.
An indirect (remote) sociological survey can be conducted by telephone, over the Internet, by mail, and so on. To carry it out, a special questionnaire with questions is usually drawn up, which respondents fill in. The results of this questionnaire are then interpreted to obtain the data the sociologist needs.
A sociological survey can be conducted using a random sample or one selected in advance according to criteria the researcher needs. A complete (census) study involves a spontaneous survey of respondents of different sex, age, social status, and education level. It covers the entire set of respondents (for example, the members of an organization).
A sample sociological survey involves selecting an audience in accordance with the subject of the study ‒ a scaled-down copy of the general population. For example, to find out which infant formula is most often purchased for children in a particular region, a sociologist might survey young mothers or nurses at perinatal centers.
When conducting a sociological survey (drawing up a questionnaire), a researcher can apply the principles of induction and deduction. When choosing the inductive method, the questions of the sociological questionnaire are worked out in a logical sequence from the particular to the general.
A sociological questionnaire drawn up using the deductive method reveals particular empirical data by presenting the respondent with general questions. This mainly concerns programmatic-thematic (outcome-oriented, substantive) questions, which reveal the motives of behavior, attitudes, knowledge, or beliefs of the public.
According to Yu. G. Volkov and V. I. Dobrenkov, the main stages of conducting a sociological survey (as with any other research in the field of sociology) are:
Processing and analysis of the results of sociological research (a survey) include editing, coding, statistical analysis, and further interpretation of the information obtained
The first known example of an opinion poll was a straw count of voter preferences published by the Raleigh Star and North Carolina State Gazette, as well as the Wilmington American Watchman and Delaware Advertiser, ahead of the 1824 presidential election, which showed Andrew Jackson leading John Quincy Adams by 335 votes to 169 in the race for President of the United States. Since Jackson went on to win the popular vote in that state and the nationwide popular vote, such straw votes gradually became more popular, but they remained a local phenomenon, usually confined to a single city.
In 1916, The Literary Digest launched a nationwide poll (partly as a circulation-boosting exercise) and correctly predicted the election of Woodrow Wilson as president. By mailing out millions of postcards and simply tallying the results, The Literary Digest also correctly predicted the victories of Warren Harding in 1920, Calvin Coolidge in 1924, Herbert Hoover in 1928, and Franklin Roosevelt in 1932.
Then, in 1936, a poll of 2.3 million voters showed that Alf Landon would win the presidential election, but instead Roosevelt was re-elected by a wide margin. George Gallup's research showed that the error was mainly caused by participation bias; those who supported Landon returned their postcards with greater enthusiasm. In addition, the postcards were sent to a target audience that was wealthier than the American population as a whole, and therefore more likely to have Republican sympathies. [ 2 ] At the same time, Gallup, Archibald Crossley, and Elmo Roper conducted polls that were much smaller but more scientifically grounded, and all three managed to correctly predict the outcome. [ 3 ] [ 4 ] The Literary Digest soon went out of business, while polling began to gain momentum. [ 3 ] Roper went on to correctly predict two subsequent re-elections of President Franklin D. Roosevelt. Louis Harris worked in the field of public opinion from 1947, when he joined Elmo Roper's firm and later became a partner in it.
In September 1938, Jean Stoetzel, after meeting with Gallup, created IFOP (the French Institute of Public Opinion) as the first European polling institute, in Paris. Stoetzel began conducting political polls in the summer of 1939 with the question « Why die for Danzig? », seeking popular support for or disagreement with this question, posed by the appeasement politician and future collaborator Marcel Déat.
Gallup launched a subsidiary in the United Kingdom, which was almost the only one to correctly predict Labour's victory in the 1945 general election: virtually every other commentator expected a victory for the Conservative Party led by the wartime leader Winston Churchill. The Allied occupying forces helped establish research institutes in all the western occupation zones of Germany in 1947 and 1948, in order to better guide denazification. By the 1950s, various types of polls had spread throughout most democracies.
Viewed from a long-term perspective, advertising came under heavy pressure in the early 1930s. The Great Depression forced companies to sharply cut advertising spending. Layoffs and cutbacks were common across all agencies. The New Deal, moreover, aggressively promoted consumerism and minimized the value (or necessity) of advertising. Historian Jackson Lears argues that "by the late 1930s, however, corporate advertisers had begun a successful counterattack against their critics". They rehabilitated the concept of consumer sovereignty by inventing scientific public opinion polling and making it a central element of their own market research, as well as a key to understanding politics. George Gallup, vice president of Young and Rubicam, and numerous other advertising experts were leaders in this. In the 1940s the industry played a leading role in the ideological mobilization of the American people in the fight against the Nazis and the Japanese in World War II. As part of this effort, they reframed the "American way of life" in terms of a commitment to free enterprise. "Advertisers", Lears concludes, "played a decisive hegemonic role in creating the consumer culture that dominated American society after World War II".
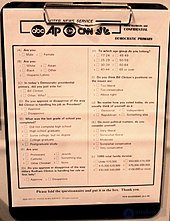
A voter survey questionnaire on display at the Smithsonian Institution
For many years public opinion polls were conducted by telecommunications or in-person contact. Methods and techniques vary, although they are widely accepted in most fields. Over the years technological innovations have also affected polling methods, such as the availability of electronic tablets and internet-based surveys.
Public opinion polls have become popular applications thanks to popular thinking, although the response rate for some polls has declined. In addition, the following has also led to differentiation of results: Some polling organizations, such as Angus Reid Public Opinion, YouGov and Zogby, use internet polls, where the sample is drawn from a large pool of volunteers, and the results are weighted to reflect the demographic characteristics of the population of interest. In contrast, popular web polls attract those who wish to participate rather than a scientific sample of the population, and are therefore generally not considered professional.
Statistical learning methods have been proposed for using social media content (such as posts on the microblogging platform Twitter) to model and predict the results of polls on voter intentions.
A benchmark poll is usually the first poll conducted during a campaign. It is often conducted before a candidate announces their bid for office, but sometimes it is conducted right after the announcement, once they have had a chance to raise funds. It is usually a short and simple poll of likely voters. A benchmark poll is often time-dependent, which can become a serious problem if the poll is conducted too early for anyone to know about the potential candidate. A benchmark poll needs to be conducted once voters begin to learn more about a possible candidate running for office.
A benchmark poll serves several purposes for a campaign. First, it gives the candidate a picture of where they stand with the electorate before any campaigning begins. If the poll is conducted before the candidate announces their candidacy, the candidate can use it to decide whether to run for office at all. Second, it shows them where their weaknesses and strengths lie in two main areas. The first is the electorate. A benchmark poll shows them which types of voters they are sure to win, which they are sure to lose, and everyone in between these two extremes. This allows the campaign to know which voters are persuadable, so they can spend their limited resources most effectively. Second, it can give them an idea of which messages, ideas, or slogans are strongest with the electorate.
In a tracking poll, responses are collected over a series of consecutive periods, for example daily, and then the results are calculated using a moving average of the responses that were collected over a fixed number of the most recent periods, for example the last five days. In this example, the next calculated results will use data from five days counted back from the following day, namely the same data as before, but including data from the following day and excluding data from the sixth day prior to that day.
However, these polls are sometimes subject to sharp fluctuations, so political campaigns and candidates are cautious in analyzing their results. An example of a tracking poll whose accuracy sparked controversy is one conducted during the 2000 U.S. presidential election by the Gallup organization. The results on one day showed Democratic candidate Al Gore leading Republican candidate George W. Bush by eleven points. Then a follow-up poll, conducted just two days later, showed Bush leading Gore by seven points. It was soon established that the volatility of the results was, at least in part, due to an uneven distribution of voters affiliated with the Democratic and Republican parties in the samples. Although the Gallup organization claimed that the volatility in the poll was a genuine representation of the electorate, other polling organizations took steps to reduce such large discrepancies in their results. One such step was manipulating the proportion of Democrats and Republicans in any given sample, but this method is a subject of controversy.
Deliberative polls combine aspects of an opinion poll and a focus group. These polls gather a group of voters and provide information on specific issues. They are then allowed to discuss these issues with other voters. Once they have learned more about the issues, they are polled about their views. Many scholars argue that this type of poll is much more effective than traditional opinion polls. Unlike traditional opinion polls, deliberative polls measure what the public thinks about issues after being offered information and the opportunity to discuss them with other voters. Because voters generally do not actively research various issues, they often base their opinions on these issues on what the media and candidates say about them. Scholars argue that these polls can genuinely reflect voters' feelings about an issue if they are given the information needed to learn more about it. Despite this, there are two problems with deliberative polls. First, they are expensive and difficult to conduct, since they require a representative sample of voters, and the information provided on specific issues must be fair and balanced. Second, the results of deliberative polls generally do not reflect the opinions of the majority of voters, since most voters do not spend time researching issues the way scholars do.
Exit polls survey voters as they leave polling stations. Unlike opinion polls, these are polls of people who have voted in the election. Exit polls give a more accurate picture of which candidates the public prefers in an election, because the people participating in the poll have voted in the election. Second, these polls are conducted at multiple polling locations across the country, which allows for comparative analysis between specific regions. For example, in the United States exit polls are useful for accurately determining how a state's voters voted, instead of relying on a nationwide poll. Third, exit polls can give journalists and sociologists deeper insight into why voters voted the way they did and what factors influenced their vote.
Exit polls have several drawbacks that can be controversial depending on how they are used. First, these polls are not always accurate and can sometimes be misleading in election coverage. For example, during the 2016 U.S. primaries, CNN reported that the Democratic primary in New York was too close to call, and they made this judgment based on exit polls. However, the vote count showed that these exit polls were misleading, and Hillary Clinton was well ahead of Bernie Sanders in the popular vote, winning the state by a margin of 58% to 42%. Excessive reliance on exit polls leads to a second point about how they undermine public trust in the media and the electoral process. In the U.S., Congress and state governments have criticized the use of exit polls because Americans tend to believe more strongly in the accuracy of exit polls. If an exit poll shows that American voters are leaning toward a certain candidate, most will assume that candidate will win. However, as mentioned earlier, exit polls can sometimes be inaccurate and lead to situations such as the 2016 New York primary, where a news organization reports misleading primary results. Government officials argue that because many Americans place greater trust in exit polls, election results are likely to make voters doubt they are being represented through the electoral process, and to cast greater doubt on the reliability of news organizations.
Over time, several theories and mechanisms have been proposed to explain erroneous poll results. Some of these reflect errors on the part of pollsters; many of them are statistical in nature. Some blame respondents for not giving pollsters genuine answers, a phenomenon known as social desirability bias (also called the Bradley effect or the shy Tory factor); these terms can be quite controversial.
Polls based on population samples are subject to sampling error, which reflects the effects of randomness and uncertainty in the sampling process. Sample surveys rely on the law of large numbers to measure the opinions of an entire population based on only a subset, and for this purpose the absolute size of the sample matters, but the percentage of the total population does not matter (unless it is close to the sample size). The possible difference between the sample and the entire population is often expressed as a margin of error — usually defined as the radius of the 95% confidence interval for a particular statistic. One example is the percentage of people who prefer product A to product B. When a single overall margin of error is reported for a poll, it refers to the maximum margin of error for all reported percentages using the full sample from the poll. If the statistic is a percentage, this maximum margin of error can be calculated as the radius of the confidence interval for a reported percentage of 50%. Others believe that a poll with a random sample of 1000 people has a sampling error of ±3% for the estimated percentage of the entire population.
A margin of error of 3% means that if the same procedure is used many times, in 95% of cases the true population mean will fall within the sample estimate plus or minus 3%. The margin of error can be reduced by using a larger sample; however, if a researcher wants to reduce the margin of error to 1%, they would need a sample of about 10,000 people. In practice, researchers need to balance the cost of a large sample against the reduction in sampling error, and a sample size of around 500–1000 is a typical compromise for political polls. (To obtain complete responses, it may be necessary to include thousands of additional participants.)
Another way to reduce the margin of error is to rely on poll averages. This assumes that the procedure is sufficiently similar across many different polls, and uses the sample size of each poll to create a poll average. Another source of error stems from flawed demographic models used by researchers, who weight their samples by certain variables, such as party identification in an election. For example, if you assume that the distribution of the U.S. population by party identification has not changed since the previous presidential election, you may underestimate the win or loss of a particular candidate from a party that has seen a surge or decline in party registration compared to the previous presidential election cycle.
Sampling methods are also used and recommended to reduce sampling errors and margin-of-error errors. In the fourth chapter of his book, author Herb Asher states: "It is probability sampling and statistical theory that make it possible to determine the sampling error, confidence levels, and the like, and to generalize the results of the sample to the broader population from which it was drawn. Other factors also play a role in making a poll scientific. A sample of sufficient size must be chosen. If the sampling error is too large or the confidence level too low, it will be difficult to make sufficiently precise statements about the characteristics of the population of interest to the pollster. A scientific poll will not only have a sufficiently large sample, it will also be sensitive to the response rate. A very low response rate will raise questions about how representative and accurate the results are. Are there systematic differences between those who participated in the poll and those who, for whatever reason, did not participate? Sampling methods, sample size, and response rate will be discussed in this chapter" (Asher 2017).
A caveat is that estimating a trend is subject to greater error than estimating a level. This is because if you estimate a change, the difference between two numbers X and Y, you have to contend with errors in both X and Y. A rough guideline is that if the change in a measurement exceeds the margin of error, it is worth noting.
Because some people do not answer calls from strangers or refuse to respond to a poll, poll samples may not be representative samples of the population due to nonresponse bias. The response rate is declining and in recent years has fallen to about 10%. Various pollsters attribute this to increased skepticism and lack of interest in polls. Because of this selection bias, the characteristics of those who agree to be interviewed may differ noticeably from the characteristics of those who refuse. That is, the actual sample represents a biased version of the universe the researcher wants to analyze. In these cases, the bias introduces new errors, one way or another, which are in addition to the errors caused by sample size. Error due to bias does not decrease with an increase in sample size, because taking a larger sample simply repeats the same error on a larger scale. If the people who refuse to respond or are never reached have the same characteristics as the people who do respond, then the final results should be unbiased. If the people who do not respond have different opinions, then there is bias in the results. As for election polls, research shows that bias effects are small, but every polling firm has its own methods of adjusting weights to minimize selection bias.
Poll results can be affected by response bias, in which the answers given by respondents do not reflect their true beliefs. This can be deliberately engineered by unscrupulous researchers to obtain a certain result or to please their clients, but more often it is the result of detailed question wording or ordering (see below). Respondents may deliberately try to manipulate the results of a poll, for example by advocating a more radical position than they actually hold in order to strengthen their side of the argument, or by giving quick and unconsidered answers in order to finish the poll faster. Respondents may also feel social pressure not to give an unpopular answer. For example, respondents may be unwilling to admit to unpopular views such as racism or sexism, and thus polls may not reflect the true prevalence of these views among the population. In American political jargon this phenomenon is often called the Bradley effect. If poll results are widely publicized, this effect can be amplified — a phenomenon commonly called the spiral of silence.
Using a plurality voting system (choosing only one candidate) in a poll introduces unintentional bias into the poll, because people who support more than one candidate cannot indicate this. The fact that they must choose only one candidate distorts the poll, causing it to favor the candidate who differs most from the others, and to disfavor candidates who are similar to other candidates. The plurality voting system distorts elections in the same way.
Some respondents may not understand the words being used, but may want to avoid the embarrassment of admitting this, or the survey mechanism may not allow for clarification, so they may make an arbitrary choice. A certain percentage of people also respond whimsically or out of irritation at being polled. This results in perhaps 4% of Americans reporting that they have personally been decapitated.
Among the factors influencing the results of opinion polls are the wording and order of the questions asked by the researcher. Questions that intentionally influence a respondent's answer are called leading questions. Individuals and/or groups use these types of questions in polls to obtain answers favorable to their interests.
For example, the public is more likely to voice support for a person whom the researcher describes as one of the «leading candidates». This description is «leading» because it points to a subtle bias in favor of this candidate, since it implies that the other contenders in the race are not serious contenders. In addition, leading questions often include or omit certain facts that can influence the respondent's answer. Argumentative questions can also affect the outcome of a poll. These types of questions, depending on their character, positive or negative, sway respondents' answers to reflect the tone of the question(s) and elicit a particular response or reaction, rather than assessing sentiment in an impartial manner.
Public opinion polls also contain «trick questions», also known as «catch questions». This type of leading question may touch on an uncomfortable or controversial topic and/or automatically assume that the subject of the question is relevant to the respondent(s) or that they are aware of it. Similarly, such questions are then worded in a way that limits the possible answers, usually to yes or no.
Another type of question that can produce inaccurate results is the «double negative question». Most often these result from human error rather than deliberate manipulation. One such example is a survey conducted in 1992 by the Roper Organization regarding the Holocaust. The question read: «Does it seem possible or does it seem impossible that the Nazi extermination of the Jews never happened?». The confusing wording of this question led to inaccurate results, which showed that 22 percent of respondents thought it was possible that the Holocaust might not have happened at all. When the question was reworded, significantly fewer respondents (only 1 percent) expressed the same opinion.
Thus, comparisons between polls often come down to question wording. In some questions, the wording can lead to fairly pronounced differences between polls. However, this can also be the result of legitimately conflicting feelings or evolving views, rather than a poorly constructed poll.
A common method for controlling this bias is alternating the order in which questions are asked. Many sociologists also use split-sample techniques. This involves having two different versions of a question, each presented to half of the respondents.
The most effective controls used by attitude researchers are:
These controls are not widely used in the polling industry. . However, since it is important for product-testing questions to be of high quality, survey methodologists are working on methods for testing them. Empirical tests provide insight into the quality of a questionnaire, some of which can be more complex than others. For example, testing a questionnaire can be done as follows:
One criticism of public opinion polls is that public assumptions that opinions between which there is no logical connection are «correlated attitudes» can push people holding one opinion into a group that forces them to pretend to hold a supposedly related, but in fact unrelated, opinion. This, in turn, can lead people holding the first opinion to claim in surveys that they hold the second opinion without actually holding it, resulting in opinion polls becoming part of self-fulfilling prophecy problems. It has been suggested that attempts to counter unethical opinions by condemning supposedly related opinions may favor groups that actually promote unethical opinions, by pushing people with supposedly related opinions to adopt them through ostracism in other parts of society, making such efforts counterproductive; that the lack of communication between groups that suspect each other of hidden motives, and the inability to express consistent critical thoughts anywhere, can create psychological stress, since people are rational; and that discussion spaces free of assumptions about hidden motives behind particular opinions should be created. In this context, it is considered important to avoid assuming that opinion polls show real connections between opinions.
Another source of error is the use of samples that are not representative of the population due to the methodology applied, as was the case in The Literary Digest's experience in 1936. For example, telephone sampling has a built-in bias, since in many cases and places those who had a telephone tended to be wealthier than those who did not.
In some places, many people have only cell phones. Because researchers in the United States cannot use automatic dialing machines to call mobile phones (since the phone's owner could be fined for accepting the call), these people are usually excluded from the survey sample. There is a concern that if the subgroup of the population without cell phones differs noticeably from the rest of the population, these differences could distort the survey results.
Polling organizations have developed a number of weighting methods to help overcome these shortcomings, with varying degrees of success. Studies of cell phone users conducted by the Pew Research Center in the US in 2007 concluded that «respondents who rely only on cell phones differ from respondents who use landlines in many important respects, (but) they were not numerous enough, and did not differ enough from each other on the issues we studied, to produce a significant change in overall population survey estimates when they were included in landline samples and weighted according to U.S. Census parameters on key demographic characteristics».
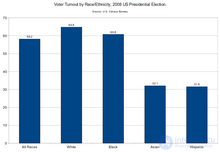
Voter turnout by race/ethnicity in the 2008 U.S. presidential election.
This problem was first identified in 2004, but did not become apparent until the 2008 U.S. presidential election. In previous elections, the share of the population using cell phones was small, but as this share grew, concerns arose that surveying landlines only was no longer representative of the population as a whole. In 2003, only 2.9% of households were wireless (cell phone only), compared to 12.8% in 2006. This leads to «coverage error». Many polling organizations build their samples by dialing random telephone numbers; however, in 2008 there was a clear trend for polls that included cell phones in their samples to show a much larger advantage for Obama than polls that did not.
Potential sources of bias:
Some polling companies have tried to work around this problem by including a «cell phone supplement». There are a number of problems with including cell phones in a telephone survey:
The most widely publicized polling failure to date in the United States was the prediction that Thomas Dewey would defeat Harry S. Truman in the 1948 U.S. presidential election. Major polling organizations, including Gallup and Roper, indicated that Dewey would defeat Truman by a wide margin; Truman won by a narrow margin.
Significant polling errors also occurred in the 1952, 1980, 1996, 2000, and 2016 presidential elections: while the first three correctly predicted the winner (though not the size of his margin), the last two correctly predicted the winner of the popular vote (but not of the electoral college).
In the United Kingdom, most polls failed to predict the Conservative victories in the 1970 and 1992 elections, as well as the Labour victory in February 1974. In the 2015 election, virtually every poll predicted a hung parliament with Labour and the Conservatives neck and neck, when the actual result was a clear Conservative majority. On the other hand, in 2017, the opposite seems to have happened. Most polls predicted an increased Conservative majority, although in reality the election resulted in a hung parliament with the Conservatives as the largest party: some polls correctly predicted this outcome.
In New Zealand, polls ahead of the 1993 general election predicted that the ruling National Party would increase its majority. However, preliminary results on election night showed a hung parliament with the National Party one seat short of a majority, prompting Prime Minister Jim Bolger to exclaim «To hell with the opinion polls» live on national television. According to the official count, the National Party won Waitaki, giving it a one-seat majority and allowing it to retain government.
Social media today is a popular tool for candidates to campaign and gauge public reaction to their campaigns. Social media can also be used as an indicator of voter opinion regarding polling. Some studies have shown that predictions made using social media signals can align with traditional opinion polls.
Regarding the 2016 U.S. presidential election, a serious concern was the effect of false stories spread through social media. Evidence shows that social media plays a huge role in delivering news: 62 percent of American adults get news from social media. This fact makes the problem of fake news on social media more pressing. Other evidence shows that the most popular fake news stories were more widely shared on Facebook than the most popular mainstream news stories; many people who see fake news report that they believe it; and the most widely discussed fake news stories tended to favor Donald Trump over Hillary Clinton. As a result of these facts, some have concluded that, had it not been for these stories, Donald Trump might not have won the election against Hillary Clinton.
By providing information about voters' intentions, opinion polls can sometimes influence voter behavior, and in his book «The Broken Compass», Peter Hitchens argues that opinion polls are in fact a tool for influencing public opinion. The various theories of how this happens can be divided into two groups: winner/loser effects and strategic («tactical») voting.
The bandwagon effect occurs when a poll prompts voters to support the candidate who is leading in the poll. The idea that voters are susceptible to such effects is old, having appeared at least as early as 1884; William Safire reported that the term was first used in a political cartoon in Puck magazine that year. It also remained persistent, despite the lack of empirical confirmation, until the late 20th century. George Gallup spent considerable effort, in vain, trying to discredit this theory in his time by presenting empirical research. A recent meta-study of scientific research on this topic shows that researchers have increasingly detected the bandwagon effect since the 1980s.
The opposite of the bandwagon effect is the underdog effect. It is often mentioned in the media. This occurs when people vote out of sympathy for a party believed to be «losing» the election. There is less empirical evidence for the existence of this effect than for the existence of the bandwagon effect.
The second category of theories about how polls directly influence voting is called strategic voting. This theory is based on the idea that voters view the act of voting as a means of choosing a government. Thus, they sometimes choose not the candidate they prefer ideologically or personally, but a different, less-preferred candidate for strategic reasons. An example can be found in the 1997 United Kingdom general election. Since he was then a cabinet minister, Michael Portillo's constituency of Enfield Southgate was considered a safe seat, but opinion polls showed that Labour candidate Stephen Twigg was steadily gaining support, which may have prompted undecided voters or supporters of other parties to back Twigg in order to unseat Portillo. Another example is the boomerang effect, in which likely supporters of a candidate shown to be winning believe that the odds are secure and that their vote is not needed, thereby allowing another candidate to win. For party-list proportional representation, an opinion poll helps voters avoid wasting their votes on a party that fails to pass the electoral threshold.
In addition, Mark Pickup, in Cameron Anderson and Laura Stephenson's book «Voting Behaviour in Canada», describes three additional «behavioral» responses that voters may display when confronted with poll data. The first effect is known as the «cue-taking effect», whereby poll data are used as a «proxy» for information about candidates or parties. Cue-taking «is based on the psychological phenomenon of using heuristics to simplify a complex decision» (243).
The second, first described by Petty and Cacioppo (1996), is known as «cognitive response» theory. This theory holds that a voter's response to a poll may not match their original perception of the electoral reality. In response, the voter is likely to create a «mental list» in which they generate reasons for the party's loss or win in the polls. This can strengthen or change their opinion of the candidate and thus affect voter behavior. The third and final possibility is a «behavioral response», which is similar to the cognitive response. The only notable difference is that the voter will go and seek out new information to form their «mental list», thus becoming better informed about the election. This can then affect voter behavior.
These effects show how public opinion polls can directly influence the political choices of the electorate. But other effects can be examined and analyzed, directly or indirectly, across all political parties. The form of media framing and shifts in party ideology should also be taken into account. In some cases, public opinion polls are a measure of cognitive bias, which is viewed and handled differently in different applications. In turn, media coverage of polling and public opinion data that lacks detail can thus even exacerbate political polarization.
Starting in the 1980s, poll tracking and related technologies began to have a noticeable impact on US political leaders. According to Douglas Bailey, a Republican who helped Gerald Ford run his 1976 presidential campaign, "a political candidate no longer needs to guess what the audience is thinking. He can [find] this out through a nightly tracking poll. So it no longer looks like political leaders will lead. Instead, they will follow."
Some jurisdictions around the world restrict the publication of public opinion poll results, especially during election periods, to prevent possibly erroneous results from influencing voters' decisions. For example, in Canada it is prohibited to publish the results of public opinion polls that identify specific political parties or candidates in the last three days before the close of voting.
However, most Western democracies do not support a complete ban on publishing pre-election public opinion polls; most of them have no rules at all, and some prohibit it only in the last few days or hours before the relevant poll closes. A study conducted by Canada's Royal Commission on Electoral Reform found that the period of the ban on publishing poll results varies considerably from country to country. Of the 20 countries examined, 3 ban publication for the entire campaign period, while others ban it for a shorter period, such as during voting or the last 48 hours before the poll closes. In India, the Election Commission banned it for 48 hours before voting begins.
The director of the Levada Center stated in 2015 that it makes no sense to draw conclusions from the results of Russian polls or to compare them with polls in democratic states, since Russia has no real political competition, where, unlike in democratic states, Russian voters are not offered any credible alternatives, and public opinion is primarily shaped by state-controlled media, which promote those in power and discredit alternative candidates. Many respondents in Russia are unwilling to answer sociologists' questions for fear of negative consequences. On March 23, 2023, a criminal case was opened against Moscow resident Yuri Kokhovets, a participant in a Radio Liberty street poll. He faces up to 10 years in prison under Russia's 2022 military censorship laws.
The well-known French sociologist Pierre Bourdieu criticized public opinion polls. First, the researcher questioned the postulate that every person has an opinion. Second, Bourdieu criticized the claim that every opinion is equally significant, and that they can therefore be summed up and presented in averaged form. Third, the sociologist considered it improper to ask everyone the same question. In his view, this implicitly indicates the existence of a consensus on a particular issue, which is far from always true.

Comments