
Lecture 41 min.
Unlike molecular kinetic theory, classical thermodynamics studies the macroscopic properties of bodies and the characteristics of various phenomena without concerning itself with their microscopic nature. Therefore, from the very beginning it operates with quantities that characterize the system as a whole (pressure, temperature, volume, etc.). As a rule, thermodynamics is unable to explain the values of particular physical parameters, which are determined experimentally. Thermodynamics is based on several fundamental laws, called the laws of thermodynamics. They were established by generalizing a large body of experimental facts. Their application makes it possible to study the course of various processes and to draw conclusions of a general nature.
An example of a state function of a system is its internal energy U. It is made up of the kinetic energy of the chaotic motion of molecules, the potential energy of interaction between molecules, the kinetic energy of atoms within molecules, the potential energy of interaction between atoms within molecules, as well as the kinetic and potential energy of the particles that make up atoms (nuclei and electrons). Internal energy does not include the kinetic and potential energy that the system may possess as a whole (say, when a vessel containing gas is moving or when the gas is placed in an external potential field). Every time the system is in the same state (for example, at some specific temperature and pressure), its internal energy takes the value characteristic of that state, regardless of the way the system was brought into that state. In a transition from state 1 to state 2, the change in internal energy is equal to the difference of the values of the internal energy in these states
|
|
|
(2.1) |
and also does not depend on which processes took the system from state 1 to 2.
The internal energy of a system can change in two ways:
Performing work is accompanied by the displacement of external bodies acting on the system. Consider a gas enclosed under a piston in a vessel (Fig. 2.1-1).
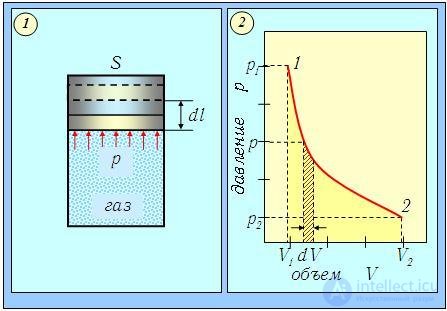
Fig. 2.1. Expansion of a gas under a piston (1) and graphical representation (2) of the work it performs
When the piston moves a distance dl, the gas does work

If S is the cross-sectional area of the vessel, then the force F can be expressed in terms of the pressure (F = pS), which for a small displacement of the piston can be considered constant. The displacement is expressed through the change in the volume of the gas

so that the elementary work done by the gas is represented in the form
|
|
|
(2.2) |
that is, it is numerically equal to the area of the shaded region on the (pV) diagram of the process (Fig. 2.1-2).
|
Work — is a measure of mechanical energy transferred from one system to another. |
This type of energy transfer is always associated with the displacement of macroscopic parts of the system and of external bodies. If no such displacement occurred, that is, if the volume of the system did not change (dV = 0), then, as follows from relation (2.2), the gas could not do work (dA = 0). When the volume of the system increases, the work is positive (the system does work), and when it decreases, the work is negative (work is done on the system by external forces).
For a finite change in the volume of the system, the work done by the gas is the sum of all the elementary works dA and is written as an integral
|
|
|
(2.3) |
Graphically, such work is represented by the area of the curvilinear trapezoid under the graph of the process on the (p,V) diagram (see Fig. 2.2). It is seen that this area depends not only on the positions of the endpoints (p1,V1) and (p2,V2), but also on the entire nature of the process of transition from state 1 to state 2 (that is, on the shape of the curve p = p(V).
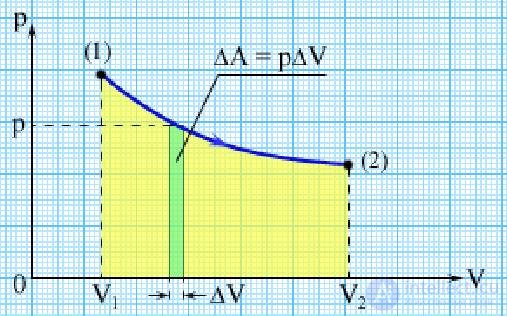
Fig. 2.2. Work done by a gas
Therefore, work is not a state function of the system.
Let us now consider the process of heat transfer to a system.
|
Quantity of heat (heat) Q is a quantitative measure of the energy of chaotic molecular motion transferred from one system to another. |
|
Heat exchange is a process of energy exchange that is not associated with the displacement of macroscopic bodies or their parts. |
The study of thermal phenomena shows that heat exchange between bodies can occur in three ways:
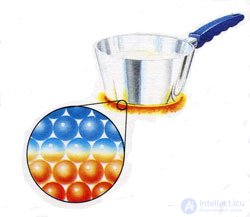
Fig. 2.3. Heat exchange by thermal conduction
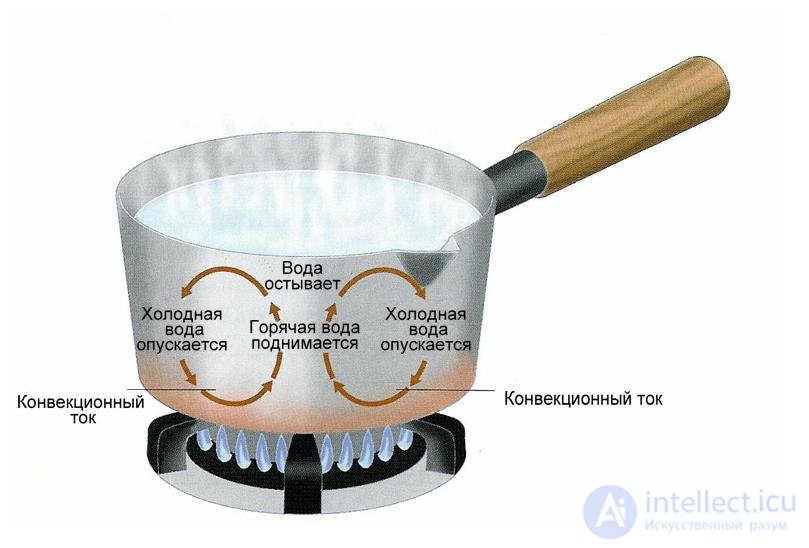
Fig. 2.4. Heat exchange by convection

Fig. 2.5. Heat exchange by radiation
Heat received by a system is considered positive, and heat given up by it is negative. Since the quantity of heat transferred in heat exchange is related to a change in the energy of motion of the molecules of the system, the chaotic, disordered motion of molecules is often called thermal motion.
Being one of the forms of energy, heat is measured in joules (J). But before the connection between heat and energy was understood, heat was measured in special units, calories. Supplying one calorie to one gram of water raises its temperature by one degree Celsius. Nowadays the calorie is defined by the relation

The calorie is still used in some areas of human activity. Recall, for example, the caloric content of foods, which many people try to limit themselves in. The oxidation of 100 g of animal fats releases about 1,000 kcal of energy (for other foods somewhat less: bread — 214 kcal, cheese — 313 kcal, sugar — 390 kcal, chocolate — 428 kcal, butter — 734 kcal).
Example. A person of mass 90 kg who wants to lose weight runs up the stairs to the 12th floor 10 times every day (the distance between floors is about 3 m). Let us determine how much weight he will lose in a week if his diet does not change.
First, let us estimate the work done in seven days:

Let us convert this work into calories:
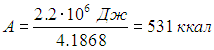
This corresponds to a loss of approximately 50 g of body mass.
Additional information:
http://eqworld.ipmnet.ru/ru/library/physics/thermodynamics.htm — J. de Boer, Introduction to Molecular Physics and Thermodynamics, IL Publ., 1962 — pp. 151–158, part 2, §§3, 4: describes Joule's experiments to determine the mechanical equivalent of heat;
The first law of thermodynamics is the law of conservation and transformation of energy applied to thermal phenomena (Fig. 2.6).
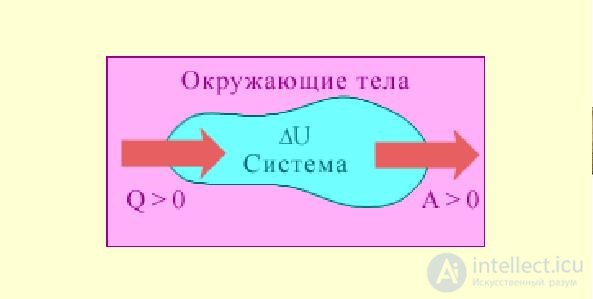
Fig. 2.6. The first law of thermodynamics
|
When a system receives thermal energy dQ, part of it is spent on doing work dA, and the remainder is used to change the internal energy dU of the system
|
For finite changes of the system parameters we have
|
|
|
(2.5) |
As we have seen, internal energy is a state function of the system, while work depends on the process by which the system goes from the initial state to the final one. It follows that heat is also not a state function of the system; it too depends on the particulars of the process under consideration. This is precisely why we used the symbols dA and dQ for the elementary increments of these quantities: had we written dA, dQ it could have given the false impression that we are dealing with differentials of functions A, Q, which in fact do not exist.
Given the equation of state (1.7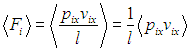 ) of an ideal gas, we will find the work it does in some typical processes. We will also determine the quantity of heat received from an external source.
1. Isochoric process. In isochoric heating or cooling (lines 1–2 and 1–3 in Fig. 2.7, respectively) the work is simply zero, since the volume does not change.
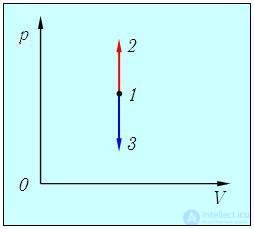
Fig. 2.7. Determination of work in an isochoric process
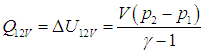
The quantity of heat received (let us denote Q12 at V = const by Q12V) goes entirely into changing the internal energy of the gas (see (1.19 ))
))
|
|
|
(2.6) |
The same quantity can be expressed in terms of the change in the temperature of the gas
|
|
|
(2.7) |
2. Isobaric process. Since p = const in this process, the pressure can be taken outside the integral sign in (2.3 ). Then we obtain (Fig. 2.8)
|
|
|
(2.8) |
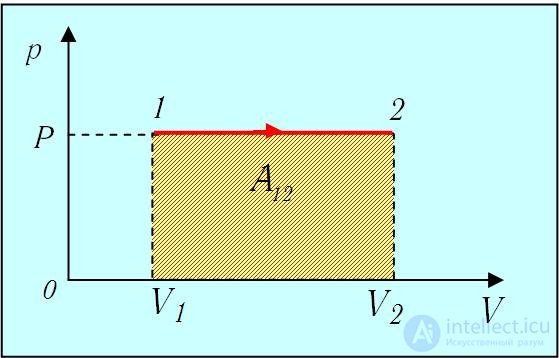
Fig. 2.8. Work in an isobaric process
The change in the internal energy of the gas follows from (1.17) – (1.19)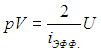
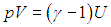
:
|
|
|
(2.9) |
Adding (2.8) and (2.9), we find the quantity of heat transferred to the gas in this process:
|
|
|
(2.10) |
Example 1. Suppose a system has received a certain quantity of heat Q at constant pressure. Let us find what part is spent on doing work A, and what part on increasing the internal energy of the gas. Let us also determine how the answer depends on the kind of gas used.
From formulas (2.8) and (2.9) it follows immediately that
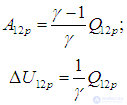
The larger g is, the greater the fraction of heat that goes into work: for monatomic gases
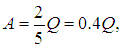
for diatomic gases (neglecting vibrations of the nuclei, with two rotational degrees of freedom)
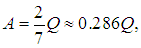
and for polyatomic gases (neglecting vibrations of the nuclei, with three rotational degrees of freedom)
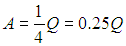
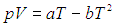
Note that we are presenting a fairly general approach that is applicable not only to ideal gases. For other systems the equation of state may change, and as a consequence the expressions for the work done will change, but the principles of their derivation remain the same. Let us give an example. Suppose that for some system the pressure, temperature, and volume are related by
|
|
|
(2.11) |
Let us find an expression for the work of such a system when its temperature changes from T1 to T2 at constant pressure. Since the pressure is constant, we have the standard expression for work in an isobaric process
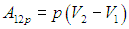
Using the equation of state (2.11), we find from this
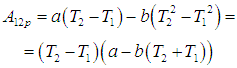
3. An isothermal process of expansion (or compression) of a gas can occur under conditions in which heat exchange between the gas and the environment takes place at a constant temperature difference. For this, the heat capacity of the environment must be sufficiently large, and the process of expansion (or compression) must proceed sufficiently slowly. The diagram of isothermal expansion is shown in Fig. 2.9.
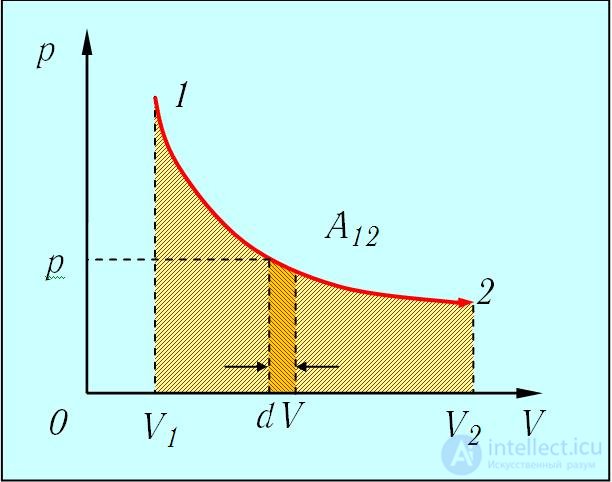
Fig. 2.9. Work during isothermal expansion of a system
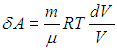
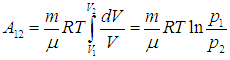
Using the equation of state and expression (2.2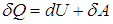 ) for the elementary work, we find
|
|
|
(2.12) |
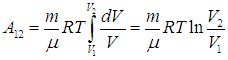
Next we use the general expression (2.3) for the work in a finite change of volume
|
|
|
(2.13) |
Since the volume is inversely proportional to the pressure, the same result can be represented in the form
|
|
|
(2.14) |
Since the internal energy of an ideal gas does not change in an isothermal process, all the heat received from the source was converted into work:

Example 2. While expanding, hydrogen did 6 kJ of work. Let us find the quantity of heat, supplied to the gas if the process was: a) isobaric; b) isothermal.
Let us first consider isobaric expansion. From formulas (2.8) and (2.10) follows the relation between the quantity of heat and the work done:
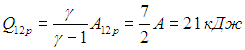
We used the value g = 7/5 for a diatomic gas. For isothermal expansion, as we saw, the quantity of heat received is simply equal to the work produced:

Let us now introduce a very important thermodynamic characteristic called the heat capacity of a system (traditionally denoted by the letter C with various subscripts).
|
Heat capacity of a system — is a physical quantity equal to the quantity of heat that must be transferred to the system to raise its temperature by one kelvin (degree):
|
Heat capacity is an additive quantity; it depends on the amount of substance in the system. Therefore the specific heat capacity is also introduced
|
Specific heat capacity is the heat capacity of a unit mass of a substance
|
and the molar heat capacity
|
Molar heat capacity is the heat capacity of one mole of a substance
|
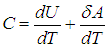
Since the quantity of heat is not a state function and depends on the process, the heat capacity will also depend on the way heat is supplied to the system. To understand this, let us recall the first law of thermodynamics. Dividing equality (2.4) by the elementary increment of absolute temperature dT, we obtain the relation
|
|
|
(2.18) |
The second term, as we have seen, depends on the type of process. Note that in the general case of a non-ideal system, in which the interaction of the particles (molecules, atoms, ions, etc.) cannot be neglected (see, for example, § 2.5 below, which considers the van der Waals gas), the internal energy depends not only on the temperature but also on the volume of the system. This is explained by the fact that the interaction energy depends on the distance between the interacting particles. When the volume of the system changes, the concentration of particles changes, and accordingly the average distance between them changes, and as a consequence the interaction energy and the entire internal energy of the system change. In other words, in the general case of a non-ideal system
 .
.
Therefore, in the general case the first term cannot be written as a total derivative; the total derivative must be replaced by a partial derivative, with an additional indication of which quantity is held constant when it is evaluated. For example, for an isochoric process:
 .
.
Or for an isobaric process

The partial derivative  entering this expression is calculated using the equation of state of the system, written in the form
  . For example, in the particular case of an ideal gas
 ,
,
this derivative is equal to
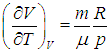 .
.
We will consider two particular cases, corresponding to heat being supplied at:
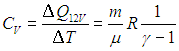
In the first case the work is dA = 0 and we obtain the heat capacity CV of an ideal gas at constant volume:
|
|
|
(2.19) |
Taking into account the caveat made above, for a non-ideal system relation (2.19) must be written in the following general form

Replacing in 2.7
 with
with  , and
, and  with
with  we immediately obtain:
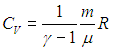 .
.
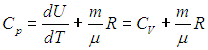
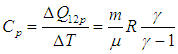
To calculate the heat capacity Cp of an ideal gas at constant pressure (dp = 0), we take into account that equation (2.8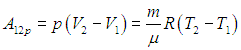 ) yields the expression for the elementary work for an infinitesimal change in temperature

We finally obtain
|
|
|
(2.20) |
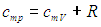
Dividing this equation by the number of moles of the substance in the system, we obtain the analogous relation for the molar heat capacities at constant volume and pressure, called Mayer's relation
|
|
|
(2.21) |
For reference, let us give the general formula, valid for an arbitrary system, relating the isochoric and isobaric heat capacities:
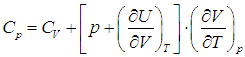
Expressions (2.20) and (2.21) are obtained from this formula by substituting into it the expression for the internal energy of an ideal gas 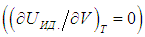 and using its equation of state (see above):
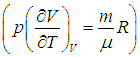 .
.
The heat capacity of a given mass of a substance at constant pressure is greater than its heat capacity at constant volume, because part of the supplied energy is spent on doing work, and to achieve the same heating more heat must be supplied. Note that (2.21) implies the physical meaning of the gas constant:
|
The gas constant R is the work done by one mole of an ideal gas when its temperature is raised by 1 K at constant pressure. |
Thus, the heat capacity turns out to depend not only on the kind of substance but also on the conditions under which the temperature change takes place.
As we see, the isochoric and isobaric heat capacities of an ideal gas do not depend on the temperature of the gas; for real substances these heat capacities generally depend also on the temperature T itself.
The isochoric and isobaric heat capacities of an ideal gas can also be obtained directly from the general definition, using the formulas (2.7) and (2.10 ) obtained above for the quantity of heat received by an ideal gas in the indicated processes.
For an isochoric process, the expression for CV follows from (2.7):
|
|
|
(2.22) |
For an isobaric process, the expression for Cp follows from (2.10):
|
|
|
(2.23) |
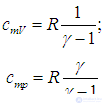
For the molar heat capacities the following expressions are obtained from this
|
|
|
(2.24) |
The ratio of the heat capacities is equal to the adiabatic exponent:
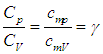
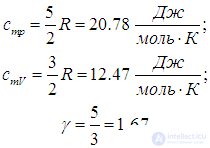
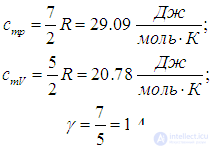
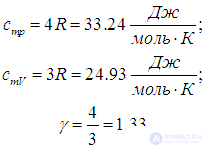
At the thermodynamic level the numerical value of g cannot be predicted; we managed to do so only by considering the microscopic properties of the system (see expression (1.19), and also (1.28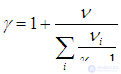 ) for a gas mixture). From formulas (1.19) and (2.24) follow the theoretical predictions for the molar heat capacities of gases and the adiabatic exponent.
Monatomic gases (i = 3):
|
|
|
(2.25) |
Diatomic gases (i = 5):
|
|
|
(2.26) |
Polyatomic gases (i = 6):
|
|
|
(2.27) |
Experimental data for various substances are given in Table 1.
Table 1
|
Substance |
|
|
g |
|
He Ar |
20.97 20.79 |
12.65 12.43 |
1.66 1.67 |
|
H2 O2 N2 CO |
28.77 29.34 29.08 29.33 |
20.42 20.90 20.87 21.12 |
1.41 1.40 1.39 1.39 |
|
CO2 NH3 |
37.23 36.70 |
28.74 27.73 |
1.30 1.32 |
|
Al Cu Ag Au Hg |
24.18 24.47 25.24 25.61 27.68 |
- - - - - |
- - - - - |
We see that the simple ideal gas model describes the properties of real gases quite well overall. Note that this agreement was obtained without taking into account the vibrational degrees of freedom of the gas molecules.
We have also given the values of the molar heat capacity of some metals at room temperature. If we picture the crystal lattice of a metal as an ordered array of hard balls connected to neighboring balls by springs, then each particle can only vibrate in three directions (ivib = 3), and each such degree of freedom is associated with a kinetic energy kBT/2 and an equal potential energy. Therefore, the internal (vibrational) energy per crystal particle is kBT. Multiplying by Avogadro's number, we obtain the internal energy of one mole

from which the value of the molar heat capacity follows

(Because of the small coefficient of thermal expansion of solids, no distinction is made between cp and cv for them). This relation for the molar heat capacity of solids is called the Dulong–Petit law, and the table shows good agreement of the calculated value

with experiment.
While the given relations agree quite well with experimental data, it should be noted that this agreement is observed only within a certain temperature range. In other words, the heat capacity of a system depends on temperature, and formulas (2.24) have a limited range of applicability. Let us first consider Fig. 2.10, which shows the experimental dependence of the heat capacity cmV of hydrogen gas on absolute temperature T.
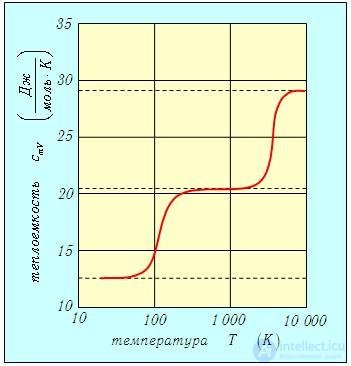
Fig. 2.10. Molar heat capacity of hydrogen gas H2 at constant volume as a function of temperature (experimental data)
Below, for brevity, we speak of molecules lacking certain degrees of freedom in certain temperature ranges. Let us remind you once again that what is actually meant is the following. For quantum reasons, the relative contribution of individual types of motion to the internal energy of a gas really does depend on temperature, and in certain temperature ranges it may be so small that it goes unnoticed in an experiment — which is always performed with finite accuracy. The result of the experiment looks as if these types of motion, and the corresponding degrees of freedom, do not exist. The number and nature of the degrees of freedom are determined by the structure of the molecule and the three-dimensionality of our space — they cannot depend on temperature.
The contribution to the internal energy depends on temperature and may be small.
At temperatures below 100 K the heat capacity is

which indicates that the molecule has neither rotational nor vibrational degrees of freedom. Then, as the temperature rises, the heat capacity increases rapidly to the classical value

characteristic of a diatomic molecule with a rigid bond, which has no vibrational degrees of freedom. At temperatures above 2 000 K the heat capacity shows a new jump to the value

This result indicates that vibrational degrees of freedom also appear. But so far all this looks inexplicable. Why can a molecule not rotate at low temperatures? And why do vibrations in the molecule arise only at very high temperatures? A brief qualitative discussion of the quantum reasons for such behavior was given in the previous chapter. For now we can only repeat that it all comes down to specifically quantum phenomena that cannot be explained from the standpoint of classical physics. These phenomena are considered in detail in the subsequent sections of the course.
Additional information
http://www.plib.ru/library/book/14222.html — Yavorsky B.M., Detlaf A.A. Handbook of Physics, Nauka, 1977 — p. 236 — a table of characteristic temperatures at which the vibrational and rotational degrees of freedom of molecules are "switched on" for some specific gases;
Let us now turn to Fig. 2.11, which shows the temperature dependence of the molar heat capacities of three chemical elements (crystals). At high temperatures all three curves tend to the same value

corresponding to the Dulong–Petit law. Lead (Pb) and iron (Fe) already have practically this limiting value of heat capacity at room temperature.
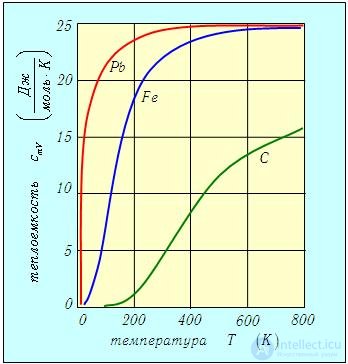
Fig. 2.11. Temperature dependence of the molar heat capacity for three chemical elements — crystals of lead, iron, and carbon (diamond)
For diamond (C), however, this temperature is still not high enough. And at low temperatures all three curves show a considerable deviation from the Dulong–Petit law. This is one more manifestation of the quantum properties of matter. Classical physics proves powerless to explain many regularities observed at low temperatures.
|
An adiabatic process is a process in which there is no heat exchange with the surroundings. |
Physically this means that the process proceeds fast enough that the system has no time to exchange heat with external bodies. However, since we are dealing with equilibrium processes, the rate of an adiabatic process must not be too great. An example of such processes is the propagation of sound waves in an elastic medium.
Let us derive the equation describing the adiabatic process. Earlier we dealt with the simplest process equations
|
|
— for an isothermal process; |
|
|
— for an isobaric process; |
|
|
— for an isochoric process. |
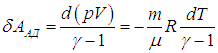
Since dQ = 0 in an adiabatic process, the first law of thermodynamics gives

On the other hand,
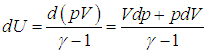
Equating these expressions, we find
|
|
|
(2.28) |
Multiplying equation (2.28) by Vg–1, we obtain a total differential on the left-hand side
|
|
|
(2.29) |
Integrating (2.29), we arrive at the equation of the adiabatic process
|
|
|
(2.30) |
Graphically, the adiabatic process is described on the (p,V) diagram by curves similar to isotherms (Fig. 2.12) but steeper, since g > 1, because Cp > CV.
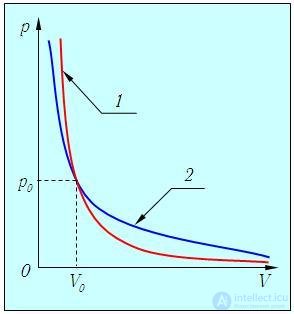
Fig. 2.12. Adiabatic process in an ideal gas: 1 — adiabat, 2 — isotherm
This is understandable, since in adiabatic expansion the gas does work at the expense of its internal energy, and its temperature falls, which reduces the pressure even more than in isothermal expansion.
An experimental study of the adiabatic process in an ideal gas can be carried out using the apparatus shown in Fig. 2.13.
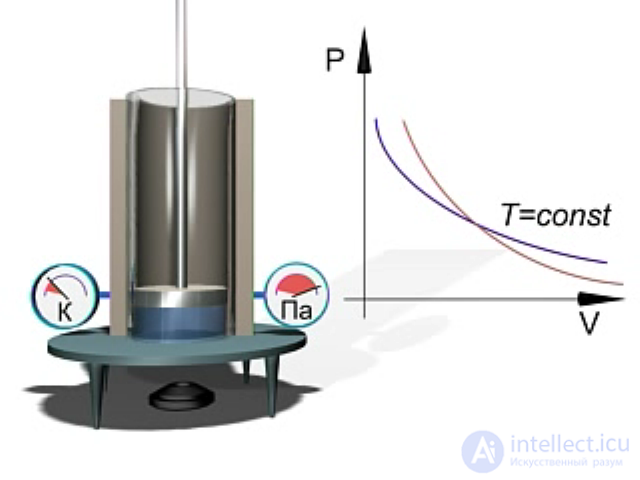
Fig. 2.13. Experimental study of the adiabatic process in an ideal gas
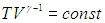
Taking into account that the equation of state of an ideal gas implies the proportionality

the equation of the adiabatic process can also be written in the form
|
|
|
(2.31) |
The first law of thermodynamics applied to the adiabatic process allows us to calculate the work done by the gas in adiabatic expansion:
|
|
|
(2.32) |
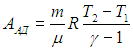
Using the Clapeyron–Mendeleev equation, the expressions for the work in an adiabatic process can also be written in terms of the temperatures at the beginning and end of the process
|
|
|
(2.33) |
For infinitesimal changes of the parameters, equations (2.32), (2.33) turn into the relations
|
|
|
(2.34) |
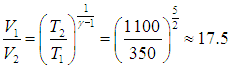
Example. The combustible mixture in a Diesel engine (see the figure above) ignites at a temperature T2 = 1 100 K. The initial temperature of the mixture is T1 = 350 K. Let us determine by what factor the volume of the mixture must be reduced during compression for it to ignite. We will regard the compression as adiabatic. The adiabatic index for the mixture is g = 1.4.
For the solution it is more convenient to use the equation of the adiabatic process in the form (2.31):
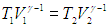
From this we immediately obtain the expression for the compression ratio of the combustible mixture:
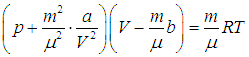
The Clapeyron–Mendeleev equation follows from the molecular kinetic theory under the assumption that the gas is ideal. If we want to describe the behavior of real systems, we must take into account the interaction of molecules with one another. An exact account of intermolecular forces is an extremely difficult problem. Therefore several modifications of the ideal gas equation of state have been proposed that could take into account the main features of real systems. The most successful attempt was the Van der Waals equation, in deriving which corrections were introduced into the ideal gas equation of state

In the Van der Waals approach, first, it is taken into account that molecules have finite sizes. If we denote by the letter b, the intrinsic volume of all the molecules in a mole of the substance, then the free volume remaining for the motion of the molecules is

and it is precisely this volume that must appear in the equation of state. Second, it is taken into account that a molecule approaching the wall of the vessel "feels" the attraction of the other molecules, which was balanced out when the molecule was inside the vessel. The additional force directed into the vessel is equivalent to an additional pressure pi, (called the "internal" pressure of the gas). Therefore, instead of the pressure p of the gas on the walls of the vessel, the equation of state must contain the sum p+pi.
How does the internal pressure pi depend on the parameters of the system? The force acting on each molecule is proportional to the concentration n of molecules in the system. The number of molecules approaching the wall is also proportional to n, and therefore the internal pressure is proportional to the square of the particle concentration:
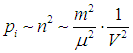
Denoting the proportionality coefficient by the letter a, we arrive at the Van der Waals equation
|
|
|
(2.35) |
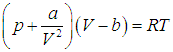
For one mole of the substance this equation simplifies:
|
|
|
(2.36) |
Additional information
http://eqworld.ipmnet.ru/ru/library/physics/thermodynamics.htm — J. de Boer, Introduction to Molecular Physics and Thermodynamics, IL Publishing, 1962 — pp. 38–47, Part I, § 6, items b, c. — discusses the Van der Waals equation and gives experimentally obtained intermolecular interaction potential energies for helium, hydrogen, argon, and carbon dioxide;
http://www.plib.ru/library/book/14222.html — Yavorsky B.M., Detlaf A.A. Handbook of Physics, Nauka, 1977 — pp. 246–248 — detailed information on the forces of intermolecular attraction in a Van der Waals gas.
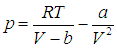
Let us consider the shape of the isotherms of a Van der Waals gas on the (p,V) diagram (Fig. 2.14). They are described by the function
|
|
|
(2.37) |
At sufficiently high temperatures and large volumes the introduced corrections can be neglected, and the isotherms take their usual shape. As the temperature decreases, the isotherms become increasingly distorted, and at a certain critical value of the temperature Tc the given isotherm acquires an inflection point (the critical point) with coordinates (pc, Vc), at which the first and second derivatives of pressure with respect to volume are zero. With a further decrease in temperature the inflection point turns into a minimum and a maximum of the function p(V).
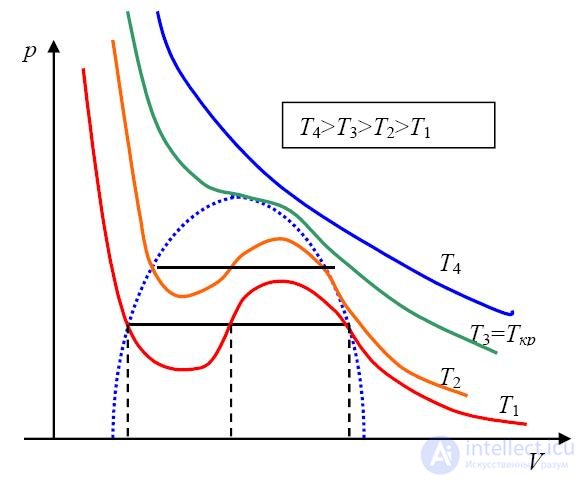
Fig. 2.14. Isotherms of a Van der Waals gas
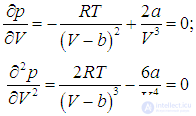
Let us first find the values of the parameters corresponding to the critical point. We take the first and second derivatives of function (2.37) and set them equal to zero:
|
|
|
(2.38) |
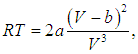
The solution of this pair of equations will give us the critical values Tc and Vc. Finding from the first equation the value
|
|
|
(2.39) |
we substitute it into the second equation, from which it then follows that
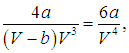
or
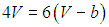
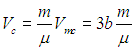
We first obtain the value of the molar critical volume
|
|
|
(2.40) |
Substituting it into equation (2.39), we find the critical temperature
|
|
|
(2.41) |
Finally, substituting the found values of Tc, Vc into equation (2.37), we find the critical pressure
|
|
|
(2.42) |
These critical values were obtained for one mole of the substance. To find them for an arbitrary number of moles, note that in passing from equation (2.36) to (2.35) one must perform the scaling transformation
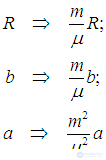
Performing the same transformation in the formulas for the critical values of the thermodynamic parameters, we find that the critical temperature and pressure do not change, while the volume transforms in the natural way:
|
|
|
(2.43) |
The values of the critical parameters are taken from experimental data. Note that the gas constant R can also be expressed in terms of the critical parameters:
|
|
|
(2.44) |
For each real gas one should calculate its own individual gas constant R, which will differ from the universal gas constant NAkB of an ideal gas. This should not be surprising, given the phenomenological, approximate nature of the Van der Waals equation. The values of the critical parameters of some substances and their gas constant are given in Table 2.
Table 2.
Critical parameters of some gases
|
Gas |
Tc , K |
pc , MPa |
Vm , cm3/mol
|
|
|
He |
5.2 |
0.23 |
57.5 |
0.82 |
|
H2 |
33.2 |
1.30 |
65.5 |
0.82 |
|
O2 |
154.8 |
5.08 |
78 |
0.82 |
|
CO2 |
304.1 |
7.39 |
94 |
0.73 |
|
H2O |
647.3 |
22.1 |
56.3 |
0.62 |
Let us take water vapor as an example. From the table we obtain the value of the coefficient
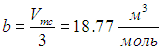
Dividing by Avogadro's number, we obtain the volume of one molecule
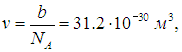
from which we obtain an estimate for the diameter of the molecule
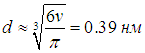
This is indeed close to the size of a water molecule, which confirms the correctness of the Van der Waals model.
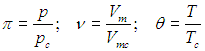
Let us introduce notation, in the form of the corresponding Greek letters, for the thermodynamic parameters measured in units of their critical values, that is, for the dimensionless ratios:
|
|
|
(2.45) |
In this notation all the critical values of the thermodynamic parameters are equal to unity, and the Van der Waals equation (2.36) takes a simple form
|
|
|
(2.46) |
Note the universality of this equation, which can be used even without exact knowledge of the values of the critical parameters (though they are of course needed when returning to the ordinary units of temperature, pressure, and volume).
Fig. 2.15 shows the isotherms of a Van der Waals gas for several values of the temperature (q=2; 1.1; 1; 0.9; 0.85).
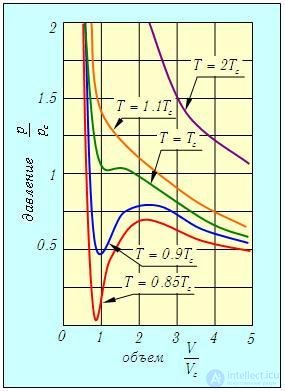
Fig. 2.15. Isotherms of a Van der Waals gas for various values of temperature (plotted for the dimensionless ratios of the thermodynamic parameters p, V , T to their critical values pc , Vc , Tc)
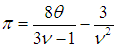
At sufficiently high temperatures T = 2Tc (q = 2) the Van der Waals isotherms coincide with the isotherms of an ideal gas except in the region of small volumes. As the temperature decreases, the hyperbolas begin to be distorted, and at T = Tc (q = 1) the graph has an inflection point at p = pc , V = Vc (p = 1, u = 1). At still lower temperatures a minimum and a maximum appear on the isotherm.
The theoretical Van der Waals isotherm differs from the experimental one. It could not be otherwise, since the region between the minimum and the maximum describes an unstable state of the system, which cannot be realized. In this region the pressure increases as the volume increases and decreases as the volume decreases. Imagine some state in this region (a point on the rising branch of the graph). If, as a result of a fluctuation, the external force holding the gas in a certain volume increases somewhat, the volume of the gas will decrease slightly, and this, unlike in ordinary states, will lead to a decrease in the gas pressure. Meeting less resistance, the external force will compress the gas more strongly, its pressure will decrease still further, and so on. In a word, such a state is as unstable as the equilibrium of a needle standing on its tip.
Therefore, if a gas is compressed isothermally (at T < Tc), then at a certain value of the volume V the pressure of the gas stops changing. In Fig. 2.16 this corresponds to point 1 on the horizontal section of the isotherm.
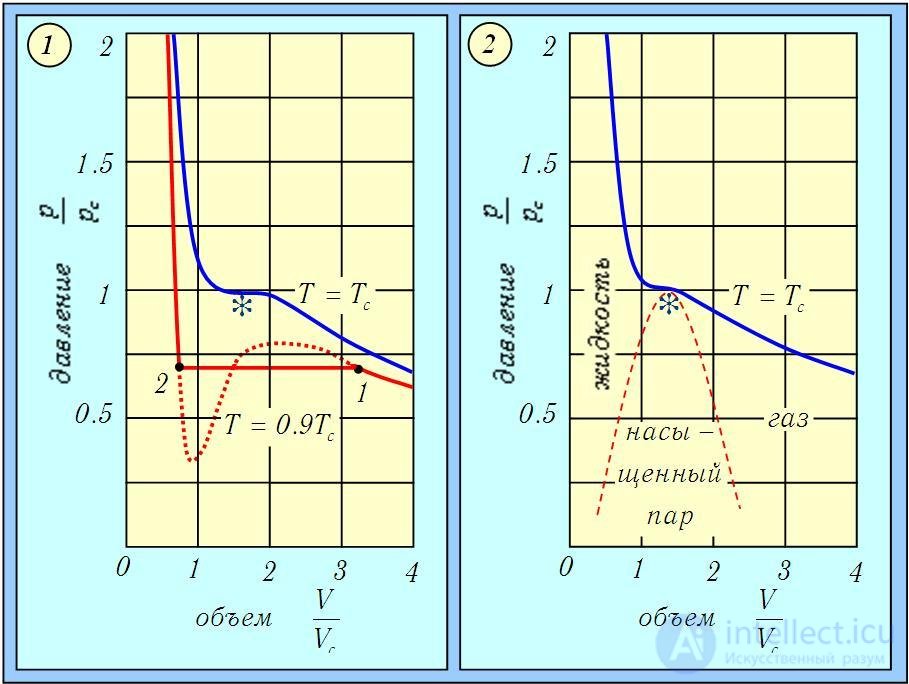
Fig. 2.16. Van der Waals isotherms: the dashed part of the isotherm at T = 0.9TC corresponds to unstable states of the gas (1); the region of saturated vapor (2) is obtained by joining the ends of the horizontal sections of the isotherms at various temperatures
In this section the gas condenses into a liquid: a saturated vapor, forms above the liquid, whose pressure ps(T) depends only on temperature and therefore does not change (Fig. 2.17).
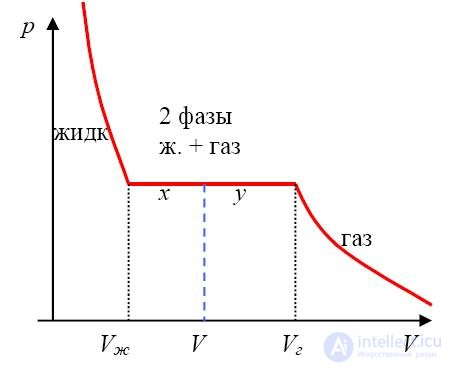
Fig. 2.17. Experimental isotherm of a real gas
Let us show that the pressure of a thermodynamically equilibrium two-phase system depends only on its temperature; to do this, we consider the conditions of thermodynamic equilibrium in such a system.
In the absence of particle exchange, the necessary conditions for thermodynamic equilibrium of two bodies are equal temperatures and equal pressures. Equality of temperatures is necessary so that there is no heat exchange between the bodies. Equality of pressures is necessary so that neither body does work on the other. When considering the equilibrium of two phases of the same substance, for example a liquid (the liquid phase) and its vapor (the gas phase), the possibility of particle exchange must additionally be taken into account. In evaporation, molecules leave the liquid phase and pass into the gas phase; in condensation, conversely, molecules pass from the gas into the liquid. In a state of thermodynamic equilibrium the average rates of these processes must be equal, so that there is — on average — no particle exchange. Let during time dt dNl-v molecules pass from the liquid into the vapor, and dNv-l molecules from the vapor into the liquid. An additional necessary condition for equilibrium of the liquid and gas phases is the equality of the rates of evaporation 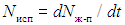 and condensation
 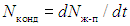 .
.
Thus, three conditions for equilibrium of the two phases must hold:
|
|
|
(2.47) |
|
|
|
(2.48) |
|
|
|
(2.49) |
where Tv, Pv, Tl, Pl are the temperature and pressure of the vapor and the liquid; T and P are their equilibrium values.
As noted in (2.49), the rates of evaporation and condensation depend, for a number of reasons, on both the pressure and the temperature of the corresponding phases (Nevap — of the liquid, Ncond — of the gas). Let us point out only some of the most obvious ones. To leave the liquid, a molecule must overcome the intermolecular attraction and, consequently, have sufficient kinetic energy for this. The higher the temperature of the liquid, the more such molecules there are, and, consequently, the higher the rate of evaporation. To pass from the gas into the liquid, a molecule must at least reach the surface of the liquid. Consequently, the rate of condensation is proportional to the flux of molecules, i.e. ∝ n < v >, where n is the concentration of molecules and < v > is their mean speed. The higher the gas pressure, the higher (at T = const) n and, correspondingly, Ncond; the higher the gas temperature, the greater ∝ T1/2 and (at n = const) Ncond.
Replacing in (2.49) the pressures and temperatures of the phases by their equilibrium values P and T from (2.47) and (2.48), we obtain the equation:
|
|
|
(2.50) |
relating the saturated vapor pressure P to the temperature of the system T:
|
|
|
(2.51) |
Thus, the saturated vapor pressure depends only on the temperature of the liquid–vapor system. The curve in the (P, T) plane corresponding to relation (2.51) is called the vaporization curve.
In exactly the same way, one can show that the pressure in a two-phase crystal–liquid system or in a crystal–gas system also depends only on the temperature of that system. The only difference is that, instead of the condition of equal evaporation and condensation rates (2.49), one must consider the condition of equal melting and crystallization rates in the first case, and equal sublimation rates and rates of the reverse process of transition from the gas phase to the crystalline phase in the second case.
Let us return to the liquid–vapor system.
As the volume of the gas is decreased further (compression), an ever larger part of it passes into the liquid state. Finally, at the volume corresponding to point 2, all of the gas has turned into liquid, the horizontal segment of the isotherm ends, and the pressure rises sharply. If we construct such horizontal segments of isotherms for various temperatures T < Tc , they fill a region whose boundary is shown by the dash-dotted line in Figure 1-2. This region (saturated vapor) corresponds to the coexistence of the liquid and gaseous phases; the region of the gaseous phase lies to its right, and that of the liquid phase to its left.
At the critical temperature T = Tc the horizontal segment of the isotherm shrinks to a point (marked with an asterisk in Fig. 1), called the critical point.
Examining the figures, we can arrive at the following conclusions:
Video 2.2. The critical state of ether.
Example 1. Let us find the largest volume V, that 1 kg of water can occupy.
As was stated, it follows from the form of the van der Waals isotherms in Fig. 2.9 that a given mass of liquid can occupy its largest volume at the critical point. We therefore use (2.44):
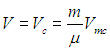
We take the value of Vmc from Table 2, whence it follows that

— three times the volume of water under ordinary conditions!
Note that the dependence of the saturated vapor pressure on temperature psat(T) shows up, in particular, as a change in the boiling point of water when climbing mountains. The boiling point is determined by equating the saturated vapor pressure to the atmospheric pressure. A decrease of the latter corresponds to a lower isotherm in our figure, that is, to a lower boiling temperature.
Recall, incidentally, that along with the atmospheric pressure and air temperature, weather reports also give the relative humidity. This is the ratio, expressed as a percentage, of the partial pressure of the water vapor contained in the air to the saturated vapor pressure at the given temperature. Thus, 100 % humidity by no means implies that we have begun to breathe water instead of air. The saturated water vapor pressure at some values of temperature is given in the table.
Saturated vapor pressure of water
|
t °C |
psat, kPa |
t °C |
psat, kPa |
t °C |
psat, kPa |
t °C |
psat, MPa |
|
0 |
0.61 |
25 |
3.17 |
60 |
19.9 |
200 |
2.32 |
|
5 |
0.87 |
30 |
4.24 |
70 |
31.2 |
250 |
3.98 |
|
10 |
1.23 |
35 |
5.63 |
80 |
47.4 |
300 |
8.59 |
|
15 |
1.71 |
40 |
7.37 |
90 |
70.1 |
350 |
16.5 |
|
20 |
2.34 |
50 |
12.3 |
100 |
101 |
374 |
22.1 |
Example 2. The radio reported that the atmospheric pressure is p = 757 mm of mercury (mercury density ρ = 3.55 g/m3), the relative humidity of the air is r = 86 %, and the air temperature is 20 °C. Let us find the absolute humidity of the air ra (that is, the mass of water vapor per unit volume), and also determine what fraction h of the atmospheric pressure is made up by the partial pressure of the water vapor.
First, let us determine the atmospheric pressure in SI units. The pressure of a mercury column of height h is

From Table 3 we find the saturated vapor pressure at the given air temperature: psat = 2.34 kPa. The partial pressure of the water vapor is

and we can already answer the second question of the problem:
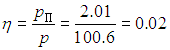
Since the absolute humidity sought is nothing other than the density of the water vapor

applying the Clapeyron–Mendeleev equation to the water vapor, we immediately find

Example 3. If the temperature in the previous example drops, fog may appear in the air. Let us determine at what temperature this will happen. Let us also find how much dew will fall on the ground when the temperature drops to 10 °C.
Video 2.3. A fog "generator": warm water and liquid nitrogen.
We need to find the temperature td (called the dew point), at which the pressure psat of the saturated water vapor becomes equal to the partial pressure of the water vapor obtained above, pv = 2.01 kPa. Then the relative humidity of the air reaches 100 %, and any further decrease in temperature will lead to condensation of the "excess" vapor. The table has no value of 2.01 kPa for the saturated vapor pressure, but we can state that the temperature sought lies in the interval from 15 °C to 20 °C. Since this interval is not very large, for a more accurate determination of the dew point we use a linear approximation: we assume that in this interval the dependence of pressure on temperature is linear:

where the pressure is measured in kPa, and the temperature in degrees Celsius. Equating psat and pv, we find the dew point
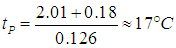
When the temperature drops to t1=10 °C, the saturated vapor pressure falls to psat1 = 1.23 kPa, as follows from the same table, that is, it becomes smaller than the previous psat = 2.01 kPa. The density of the water vapor decreases in the same proportion:
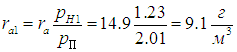
Therefore, from each cubic meter of air the following amount will fall to the ground:

Additional information
http://kvant.mirror1.mccme.ru/ — Kvant magazine, 2004, No. 2, pp. 23–25, V. Mozhaev, "Saturated and unsaturated water vapor" — several interesting problems on the evaporation of water are solved;
http://www.alleng.ru/d/phys/phys62.htm — M. E. Tulchinsky, Qualitative Problems in Physics, Prosveshchenie Publ., 1972; problem No. 611 on saturated vapors;
http://kvant.mirror1.mccme.ru/1996/05/otkuda_berutsya_oblaka.htm — Kvant magazine, 1996, No. 5, pp. 40–41, A. Aizenkraft, L. Kirpatrick, Where do clouds come from?
http://experiment.edu.ru/catalog.asp?cat_ob_no=12329&ob_no=12384 — Demonstration of boiling of a liquid at reduced pressure;
http://experiment.edu.ru/catalog.asp?cat_ob_no=12329&ob_no=12390 — Demonstration of the expansion of water on freezing;
http://by-chgu.ru/category/physics — Physical Encyclopedia, vol. 1, Moscow, 1988, pp. 278–279 — describes the use of supersaturated vapor for detecting electrically charged particles in the Wilson cloud chamber;
http://by-chgu.ru/category/physics — Physical Encyclopedia, vol. 4, Moscow, 1994, pp. 177–179 — describes the use of a superheated liquid for detecting electrically charged particles.
Video 2.4. Superheated liquid: adding vaporization centers causes the superheated liquid to boil.
The presence of the "internal" pressure

of a van der Waals gas means that the internal energy of such a gas, compared with the internal energy of an ideal gas Uid , includes an additional term — the potential energy of interaction of the molecules with one another. This additional potential energy turns out to be

where the "minus" sign signifies attraction between the molecules. Then for the internal energy of a van der Waals gas we have the relation
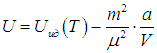
This formula reflects the fact that when the volume of a gas increases, work is done against the attractive forces between the molecules. It yields a theoretical explanation of the Joule–Thomson effect (Fig. 2.18).
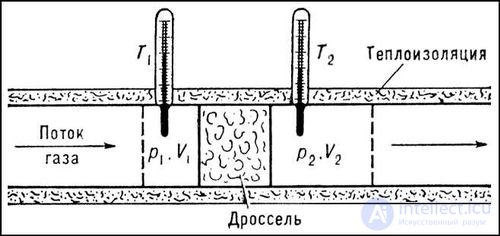
Fig. 2.18. The Joule–Thomson effect
In this effect the gas expands adiabatically into a vacuum. Since no heat is supplied and the gas does no work against external pressure, its internal energy U must remain constant. For an ideal gas this is equivalent to constancy of temperature. But for a van der Waals gas, the decrease of the subtracted term in the expression for the internal energy at U = const entails a decrease of the first term, that is, a drop in temperature. This effect is used in the liquefaction of gases. In substances in which repulsion between molecules dominates, the addition to U is positive, and a rise in temperature is observed upon adiabatic expansion, that is, the inverse Joule–Thomson effect.
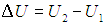

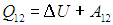














 ;
; ;
; ,
, ,
, .
.
Comments