Lecture
In the overwhelming majority of sources of information about neural networks, “now let's educate our network” means “feed the objective function to the optimizer” with only the minimum learning speed setting. It is sometimes said that the weights of the network can be updated not only by stochastic gradient descent, but without any explanation, what is remarkable about other algorithms and what the mysterious ones mean and
in their parameters. Even teachers in machine learning courses often do not focus on this. I would like to correct the lack of information in runet about various optimizers that you may encounter in modern machine learning packages. I hope my article will be useful to people who want to deepen their understanding of machine learning or even invent something of their own.
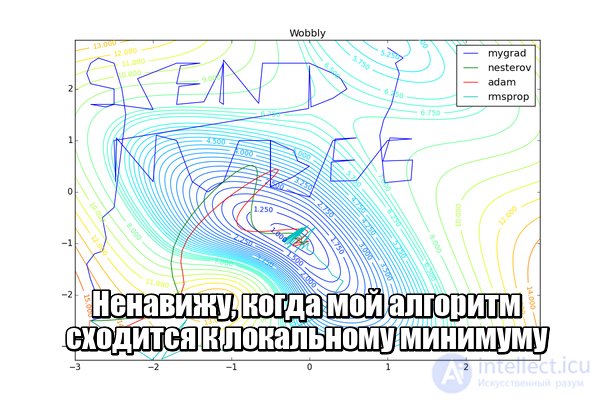
Under the cut a lot of pictures, including animated gif.
The article is aimed at a reader familiar with neural networks. It is assumed that you already understand the essence of backpropagation and SGD. I will not go into a strict proof of the convergence of the algorithms presented below, but on the contrary, I will try to convey their ideas in simple language and show that the formulas are open for further experiments. The article lists not all the complexities of machine learning and not all the ways to overcome them.
Let me remind you what formulas look like for ordinary gradient descent:
Where - network settings
- the objective function or loss function in the case of machine learning, and
- learning speed. It looks amazingly simple, but a lot of the magic is hidden in
- update the parameters of the output layer is quite simple, but to get to the parameters of the layers behind it, you have to go through nonlinearities, the derivatives of which contribute to. This is the familiar principle of the reverse propagation of error - backpropagation.
Explicitly written formulas for updating the scales somewhere in the middle of the network look ugly, because each neuron depends on all the neurons with which it is connected, and those from all the neurons with which they are connected, and so on. At the same time, even in “toy” neural networks, there can be about 10 layers, and among the networks that keep modern classifications of modern datasets - much, much more. Each weight is variable in . Such an incredible amount of degrees of freedom allows you to build very complex displays, but brings researchers a headache:
Computational mathematics known advanced algorithms of the second order, which is able to find a good minimum and on a complex landscape, but then the number of weights hits again. To use the honest method of the second order "in the forehead," you have to count the Hessian. - the matrix of derivatives for each pair of parameters of a pair of parameters (already bad) - and, say, for the Newton method, also the inverse of it. We have to invent all sorts of tricks to cope with problems, leaving the task computationally lifting. Second-order working optimizers exist, but for now let's concentrate on what we can achieve without considering second derivatives.
By itself, the idea of methods with the accumulation of momentum is obviously simple: "If we move for a while in a certain direction, then we probably should go there for some time in the future." To do this, you need to be able to refer to the recent change history of each parameter. You can store the latest copies
and at each step it is fair to assume an average, but this approach takes too much memory for large
. Fortunately, we do not need an exact average, but only an estimate, so we use the exponential moving average.
To accumulate something, we will multiply the accumulated value by the conservation factor and add another value multiplied by
. The closer
to one, the larger the accumulation window and the stronger the smoothing is history
begins to influence more than every next
. If a
from a certain moment
decay exponentially exponentially, hence the name. We apply the exponential running average to accumulate the gradient of the objective function of our network:
Where usually takes order
. note that
not lost, but included in
; Sometimes you can find a variant of the formula with an explicit multiplier. The smaller
, the more the algorithm behaves like a normal SGD. To get a popular physical interpretation of the equations, imagine how the ball rolls along a hilly surface. If at the moment
under the ball was a non-zero bias (
), and then it hit the plateau, it will still continue to roll along this plateau. Moreover, the ball will continue to move a couple of updates in the same direction, even if the bias has changed to the opposite. However, viscous friction acts on the ball and every second it loses
its speed. Here's what the accumulated impulse looks like for different
(hereinafter, epochs are plotted along the X axis, and the gradient value and accumulated values are along the Y axis):
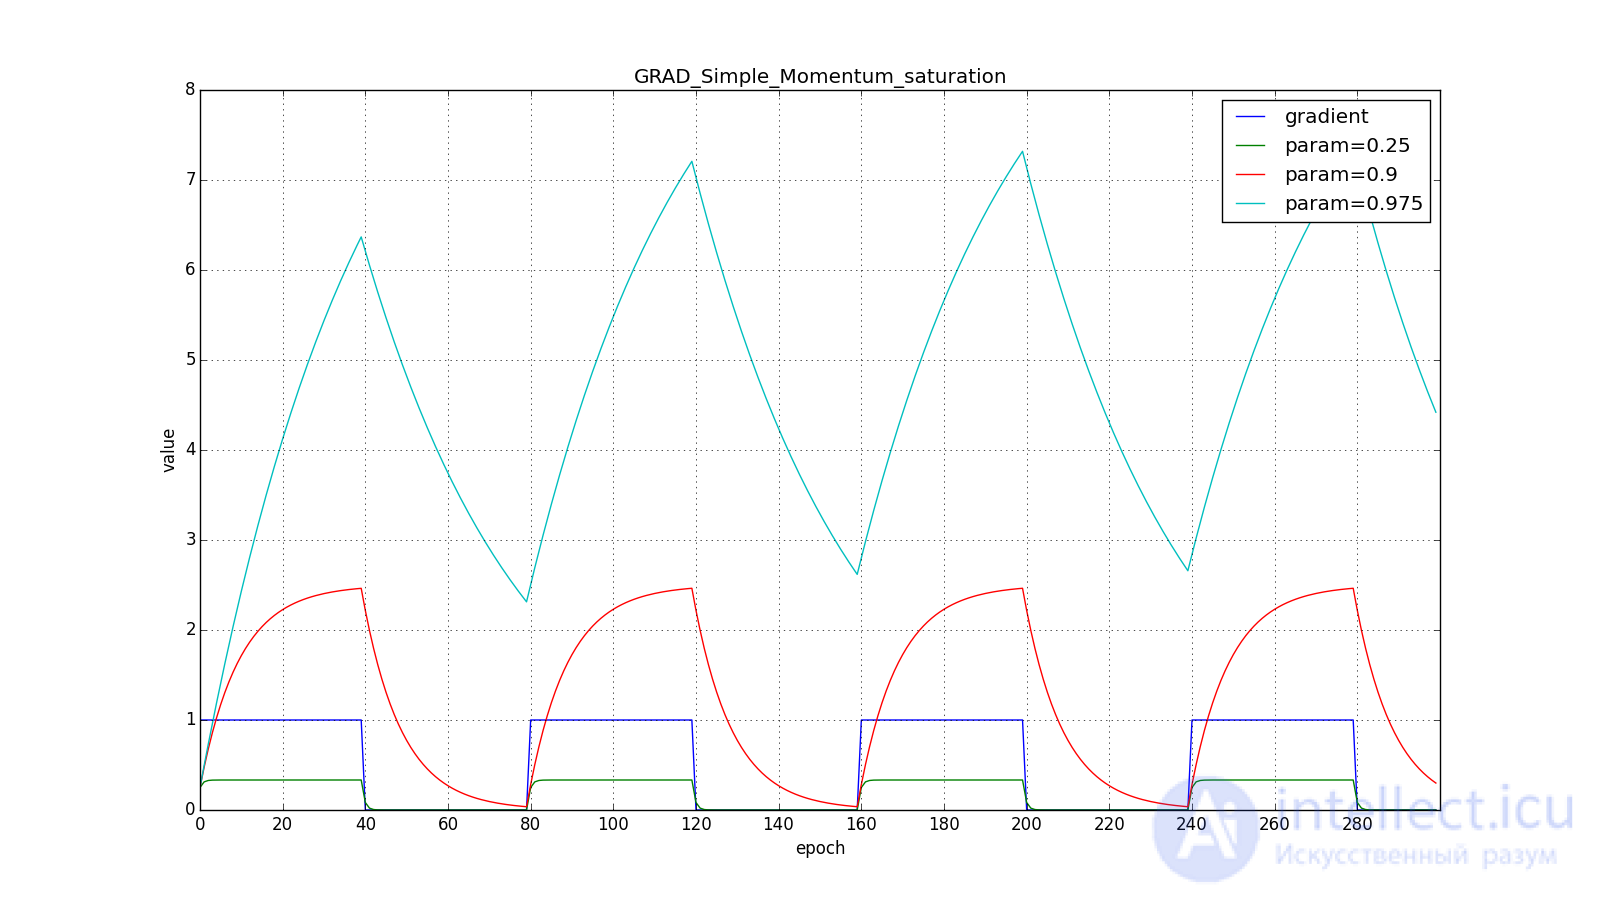
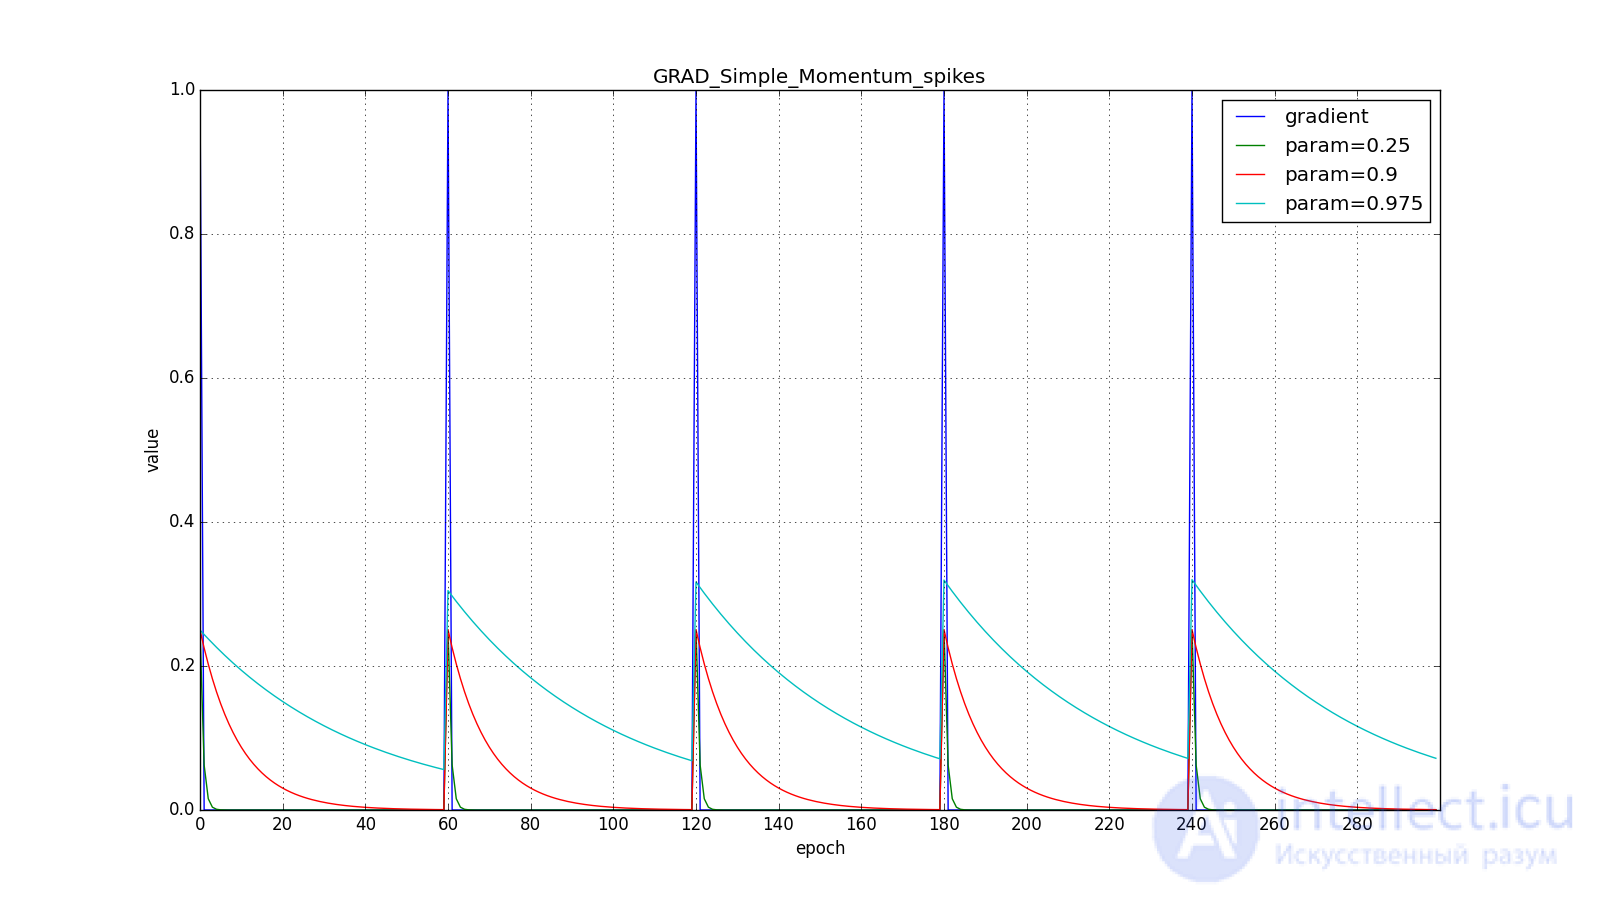
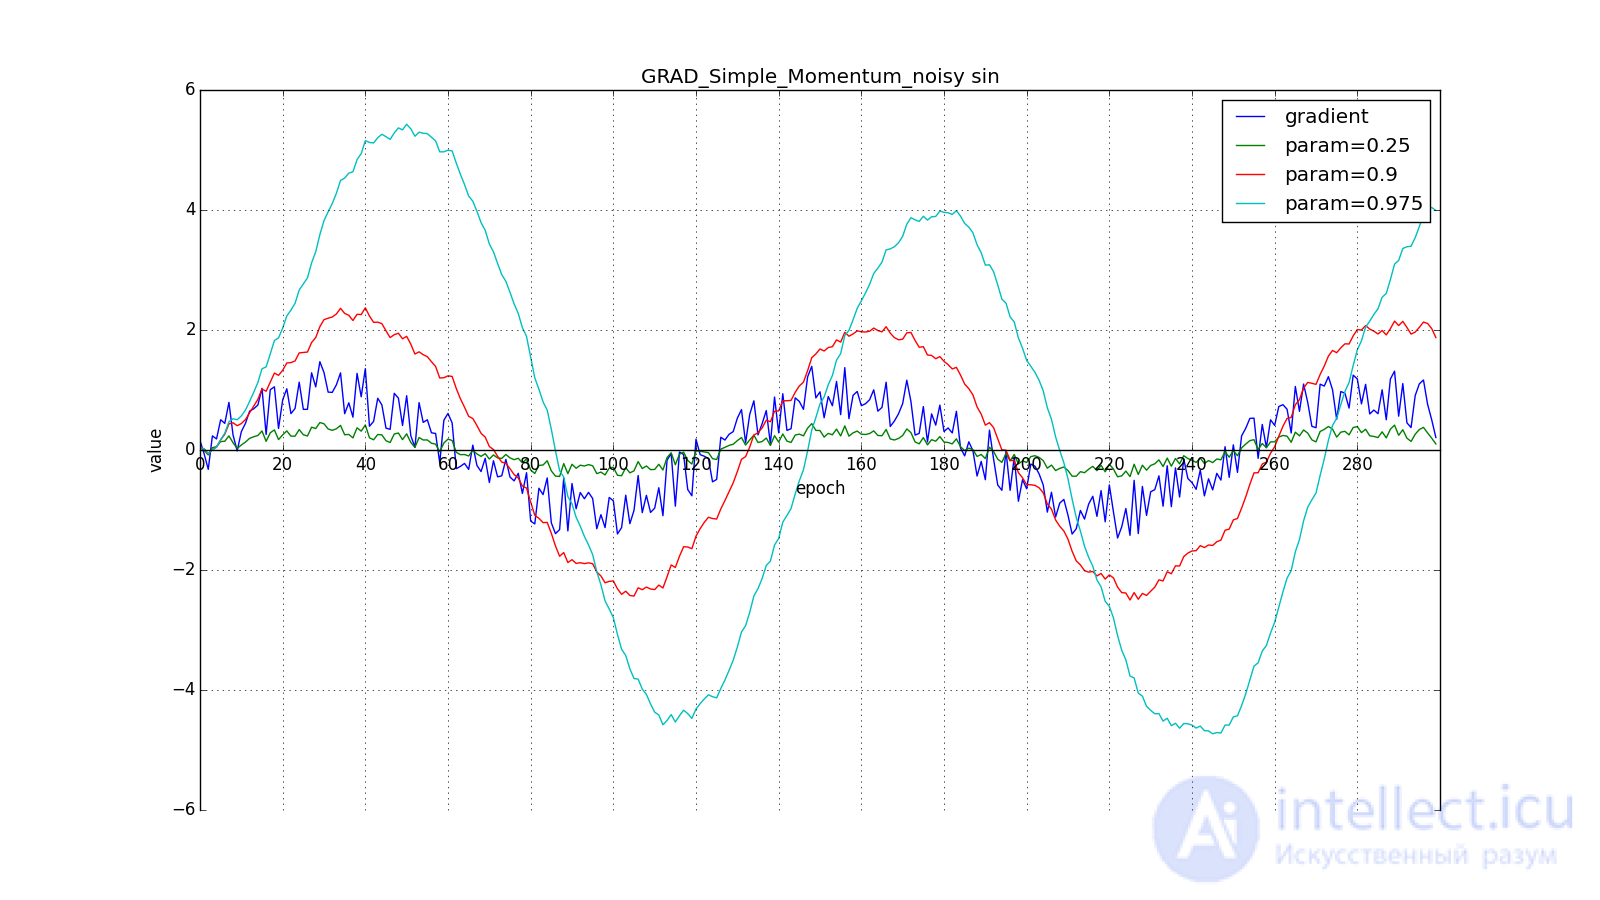
Note that the accumulated in the value can greatly exceed the value of each of
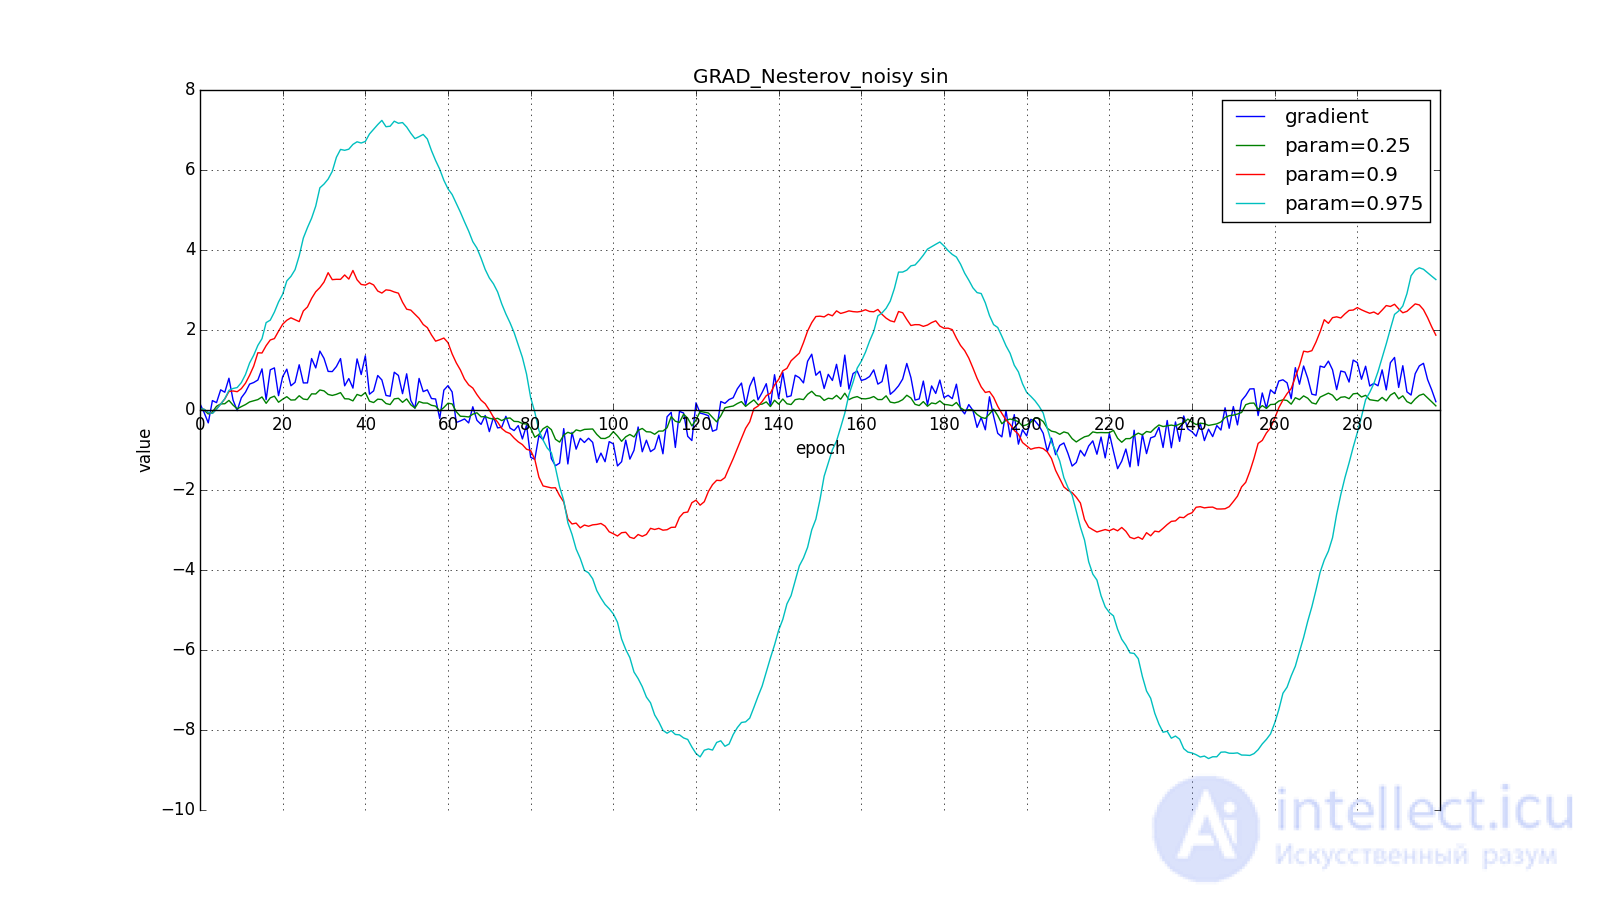
. A simple accumulation of momentum already gives a good result, but Nesterov goes further and applies the idea well-known in computational mathematics: looking ahead along the update vector. Since we're still going to shift to
then let's calculate the loss function gradient not at the point
and in
. From here:
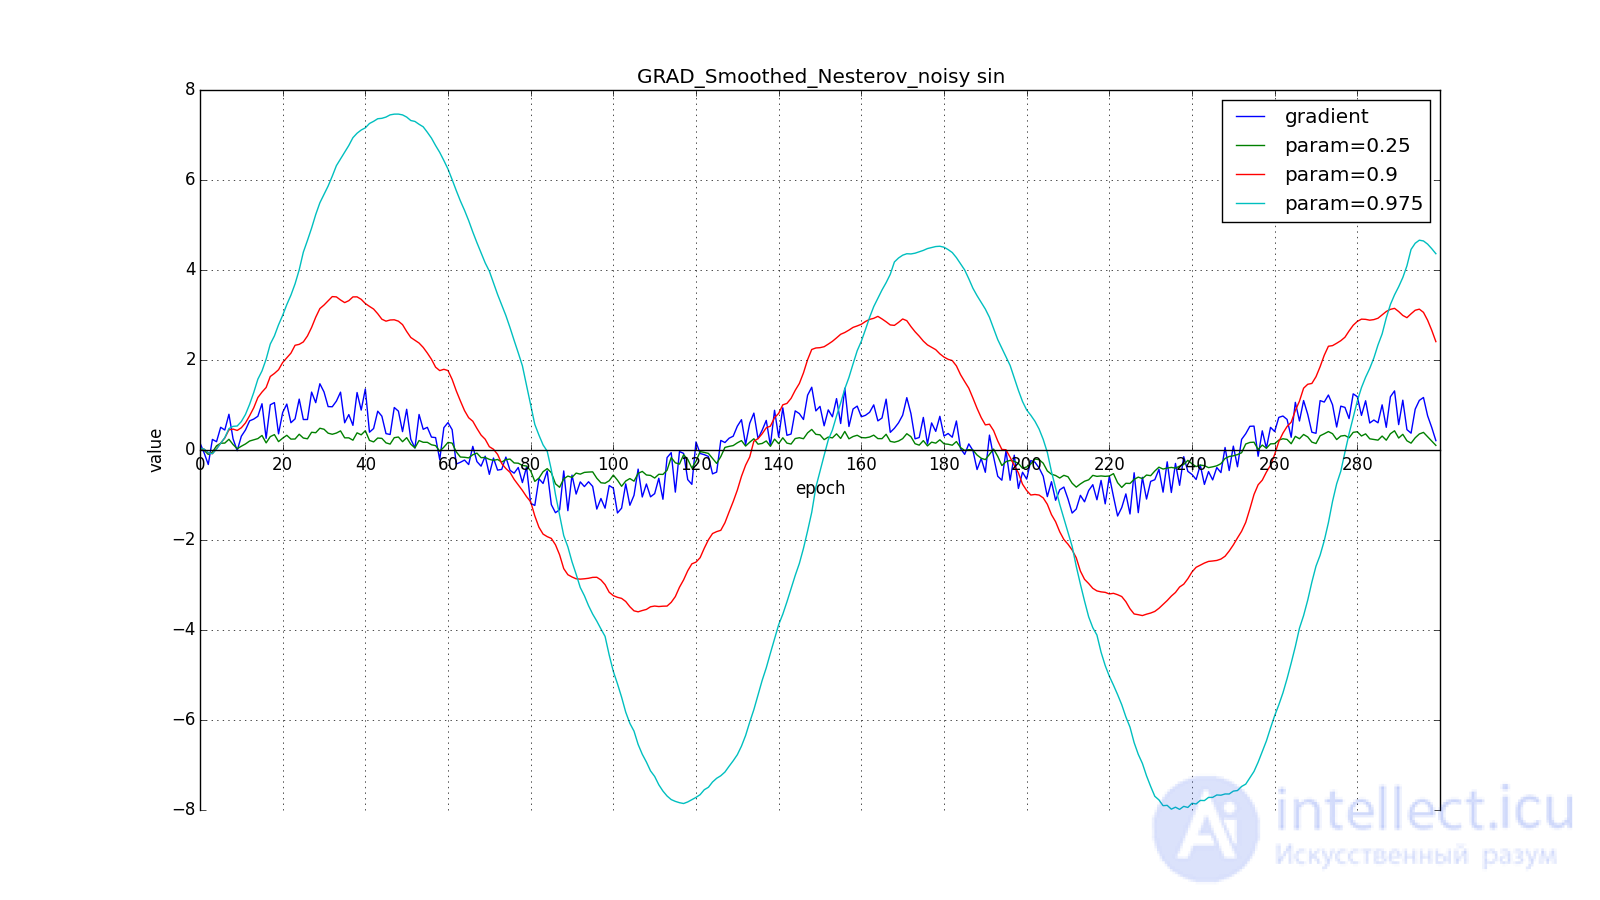
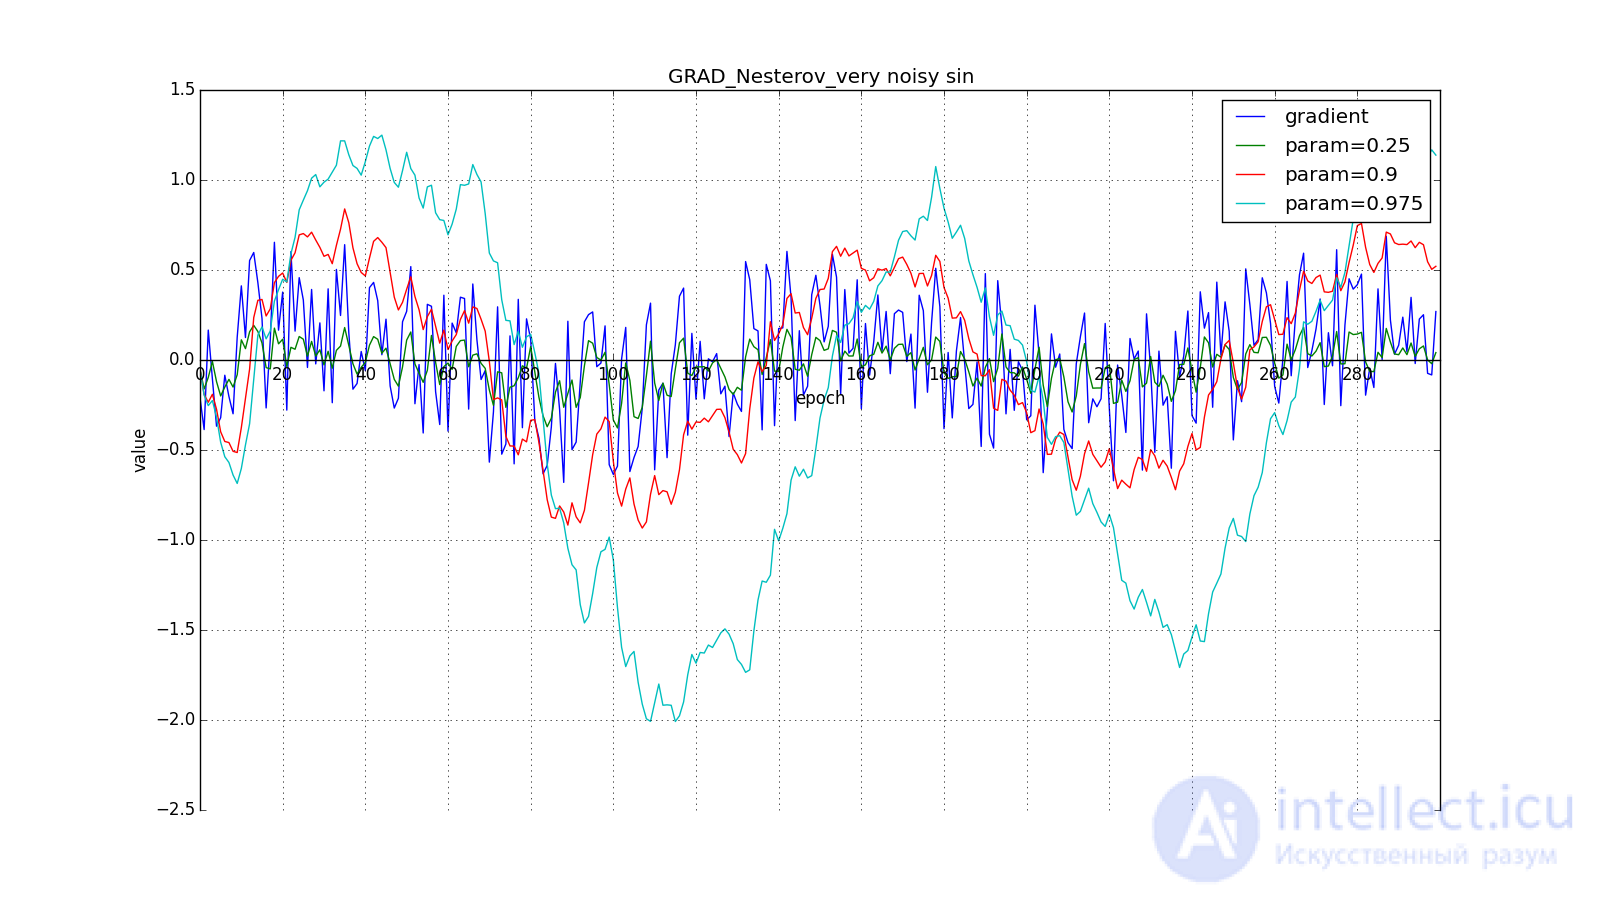
Such a change allows you to “roll” faster if, aside, where we are going, the derivative increases, and more slowly, if vice versa. This is especially evident for for a graph with a sine.
Looking ahead can play a cruel joke on us if you set too large and
: we look so far that we miss the areas with the opposite gradient sign:
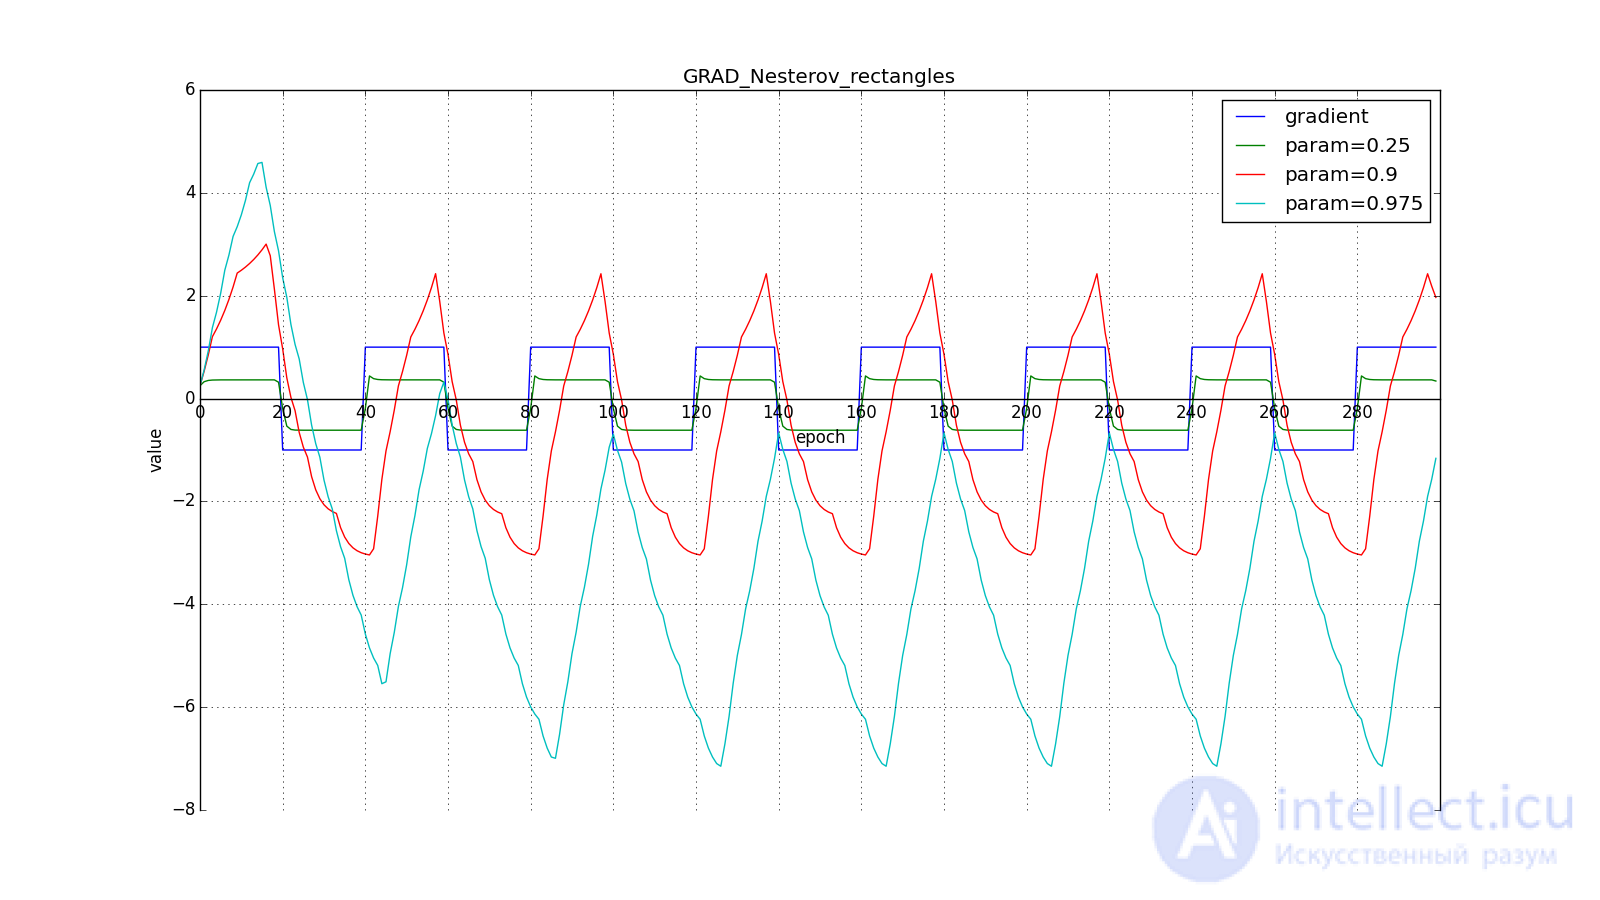
However, sometimes this behavior may be desirable. I once again draw your attention to the idea - looking ahead - and not to execution. The Nesterov method (6) is the most obvious option, but not the only one. For example, you can use another technique from computational mathematics — stabilization of the gradient by averaging over several points along the line along which we move. So to speak:
Or so:
Such a technique can help in the case of noisy target functions.
We will not manipulate the argument of the objective function in subsequent methods (although, of course, no one bothers you to experiment). Further, for brevity
How methods with the accumulation of momentum are imagined by many. Let us turn to more interesting optimization algorithms. Let's start with a relatively simple Adagrad - adaptive gradient.
Some signs may be extremely informative, but rarely occur. Exotic high-paying profession, a fancy word in the spam database - they will easily drown in the noise of all other updates. It is not only about rarely encountered input parameters. Let's say that you may well encounter rare graphic patterns that even become a sign only after passing through several layers of a convolutional network. It would be nice to be able to update the parameters with an eye on how typical they sign. To achieve this is not difficult: let's store for each network parameter the sum of the squares of its updates. It will act as a proxy for typicality: if the parameter belongs to a chain of frequently activated neurons, it is constantly pulled back and forth, which means the amount quickly accumulates. Rewrite the update formula like this:
Where - the sum of the squares of the updates, and
- smoothing parameter necessary to avoid dividing by 0. The parameter that was frequently updated in the past is large
, is the big denominator in (12). Parameter changed only one or two will be updated in full force.
take order
or
for a completely aggressive update, but, as can be seen from the graphs, this plays a role only at the beginning, towards the middle, the training begins to outweigh
:
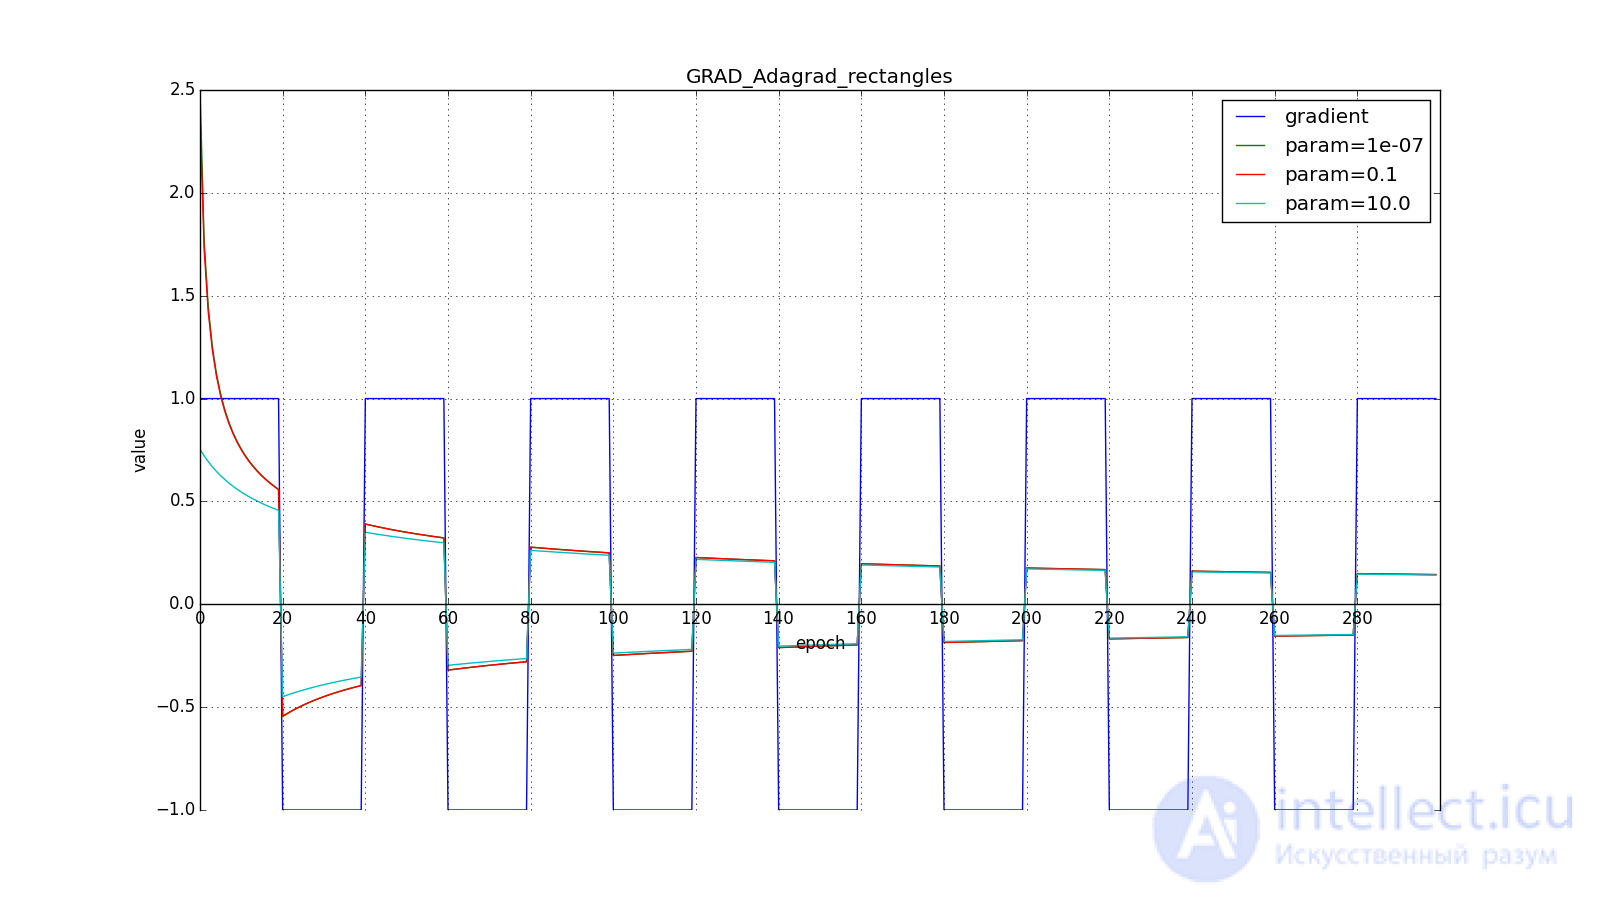
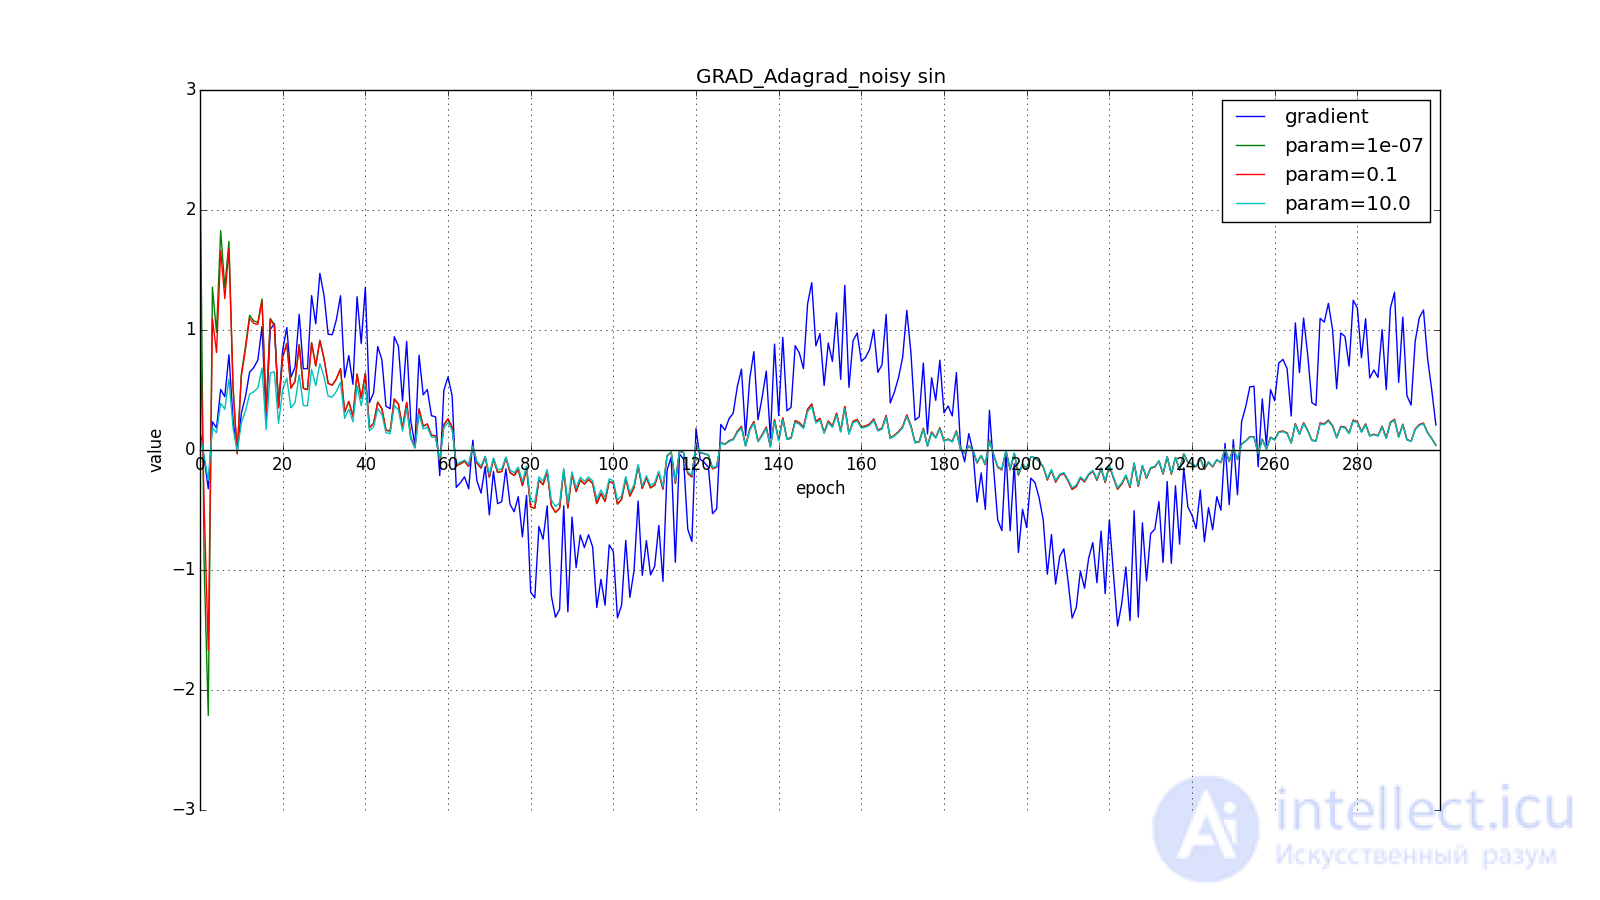
Итак, идея Adagrad в том, чтобы использовать что-нибудь , что бы уменьшало обновления для элементов, которые мы и так часто обновляем. Никто нас не заставляет использовать конкретно эту формулу, поэтому Adagrad иногда называют семейством алгоритмов. Скажем, мы можем убрать корень или накапливать не квадраты обновлений, а их модули, или вовсе заменить множитель на что-нибудь вроде .
(Другое дело, что это требует экспериментов. Если убрать корень, обновления начнут уменьшаться слишком быстро, и алгоритм ухудшится)
Ещё одно достоинство Adagrad — отсутствие необходимости точно подбирать скорость обучения. Достаточно выставить её в меру большой, чтобы обеспечить хороший запас, но не такой громадной, чтобы алгроритм расходился. По сути мы автоматически получаем затухание скорости обучения (learning rate decay).
Недостаток Adagrad в том, что в (12) может увеличиваться сколько угодно, что через некоторое время приводит к слишком маленьким обновлениям и параличу алгоритма. RMSProp и Adadelta призваны исправить этот недостаток.
Модифицируем идею Adagrad: мы всё так же собираемся обновлять меньше веса, которые слишком часто обновляются, но вместо полной суммы обновлений, будем использовать усреднённый по истории квадрат градиента. Снова используем экспоненциально затухающее бегущее среднее
(4). Let be — бегущее среднее в момент
тогда вместо (12) получим
Знаменатель есть корень из среднего квадратов градиентов, отсюда RMSProp — root mean square propagation
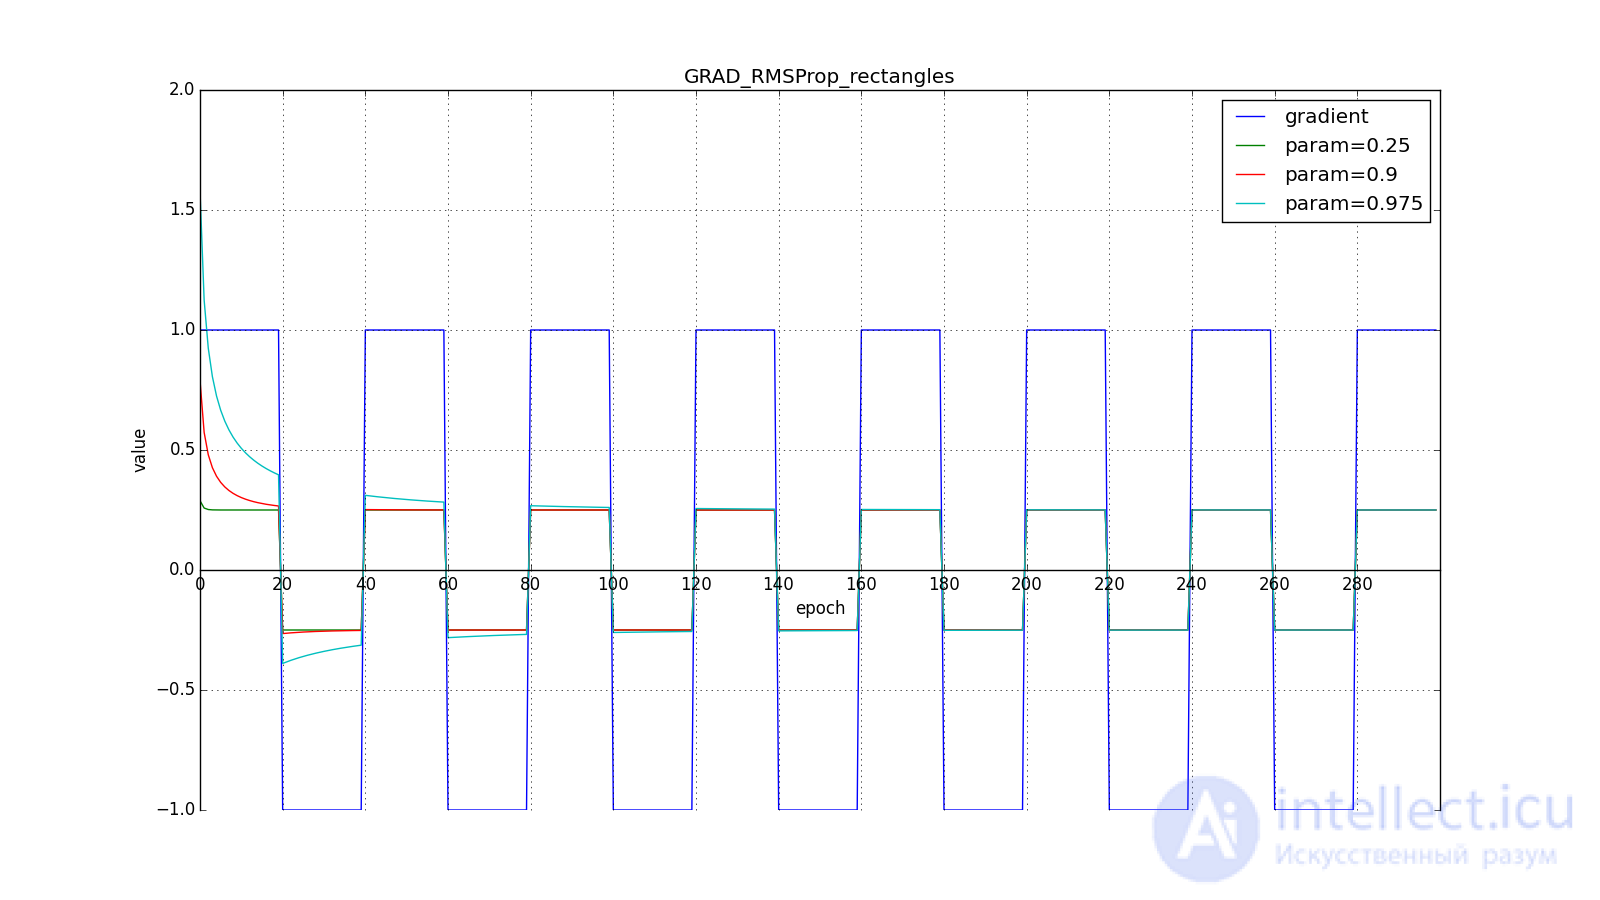
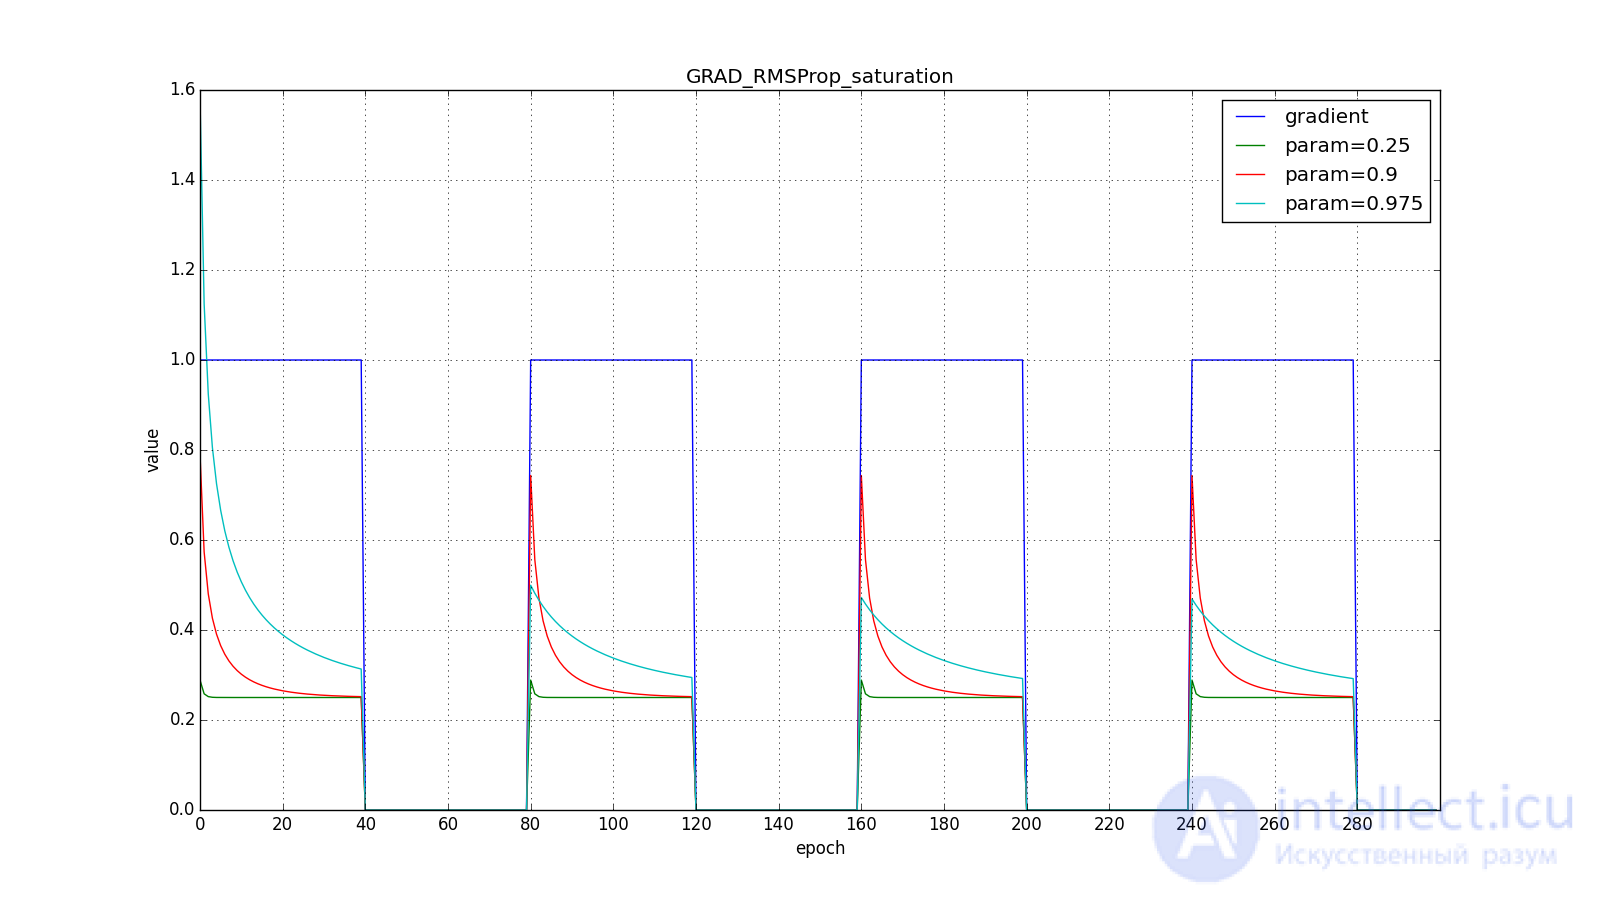
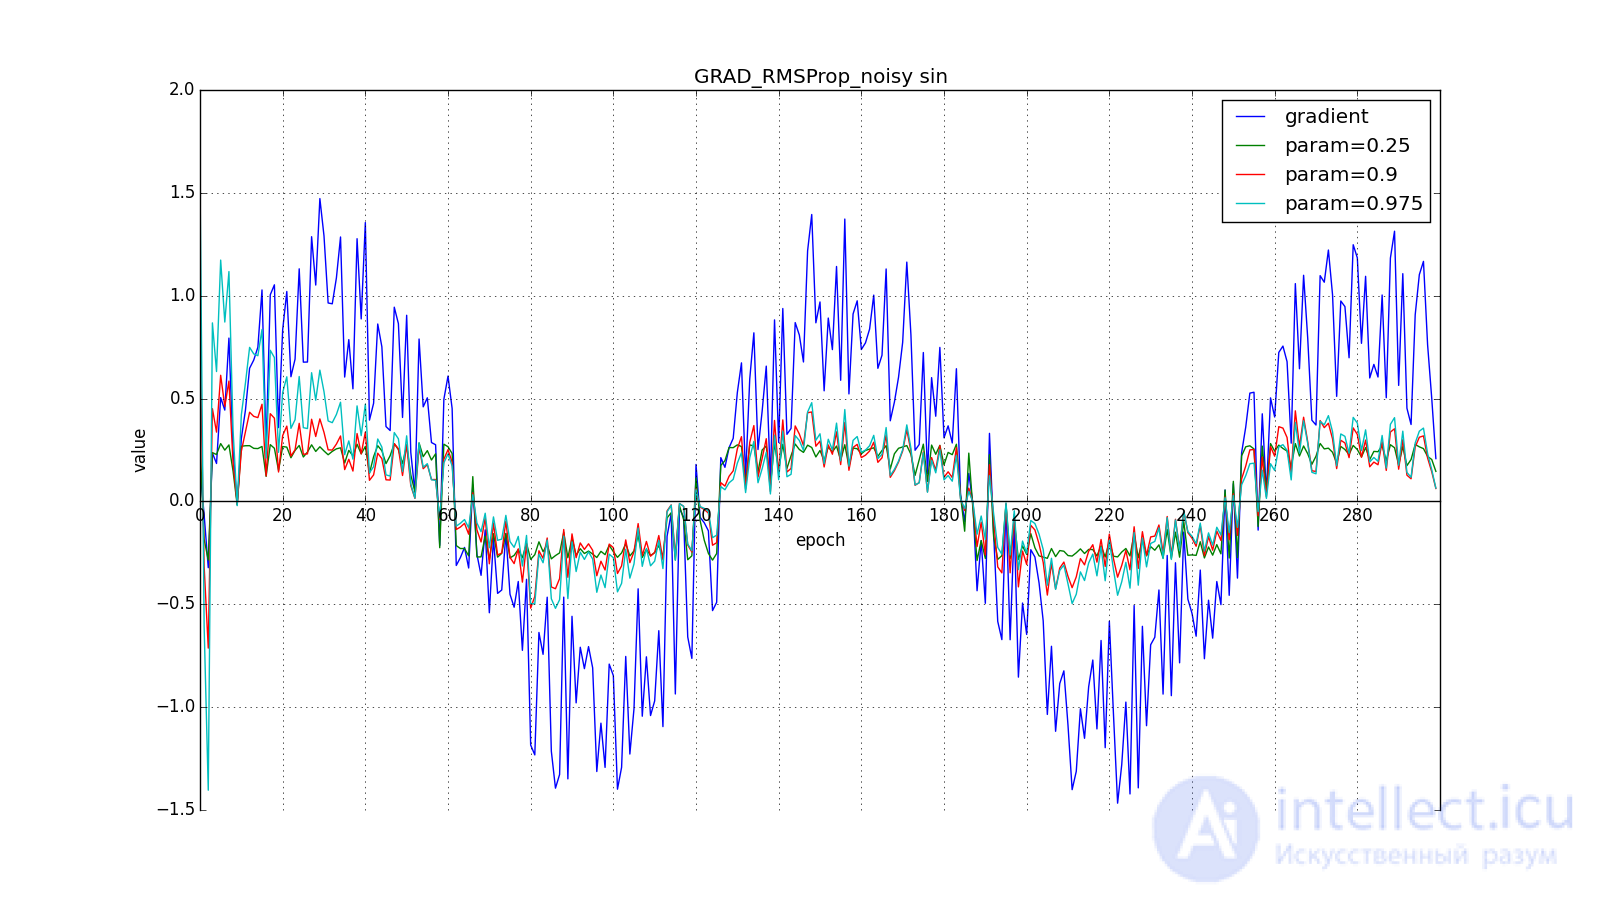
Обратите внимание, как восстанавливается скорость обновления на графике с длинными зубцами для разных . Также сравните графики с меандром для Adagrad и RMSProp: в первом случае обновления уменьшаются до нуля, а во втором — выходят на определённый уровень.
Вот и весь RMSProp. Adadelta от него отличается тем, что мы добавляем в числитель (14) стабилизирующий член пропорциональный from
. На шаге
мы ещё не знаем значение
, поэтому обновление параметров происходит в три этапа, а не в два: сначала накапливаем квадрат градиента, затем обновляем
, после чего обновляем
.
Такое изменение сделано из соображений, что размерности and
должны совпадать. Заметьте, что learning rate не имеет размерности, а значит во всех алгоритмах до этого мы складывали размерную величину с безразмерной. Физики в этом месте ужаснутся, а мы пожмём плечами: работает же.
Заметим, что нам нужен ненулевой для первого шага, иначе все последующие
, а значит и
будут равны нулю. Но эту проблему мы решили ещё раньше, добавив в
. Другое дело, что без явного большого
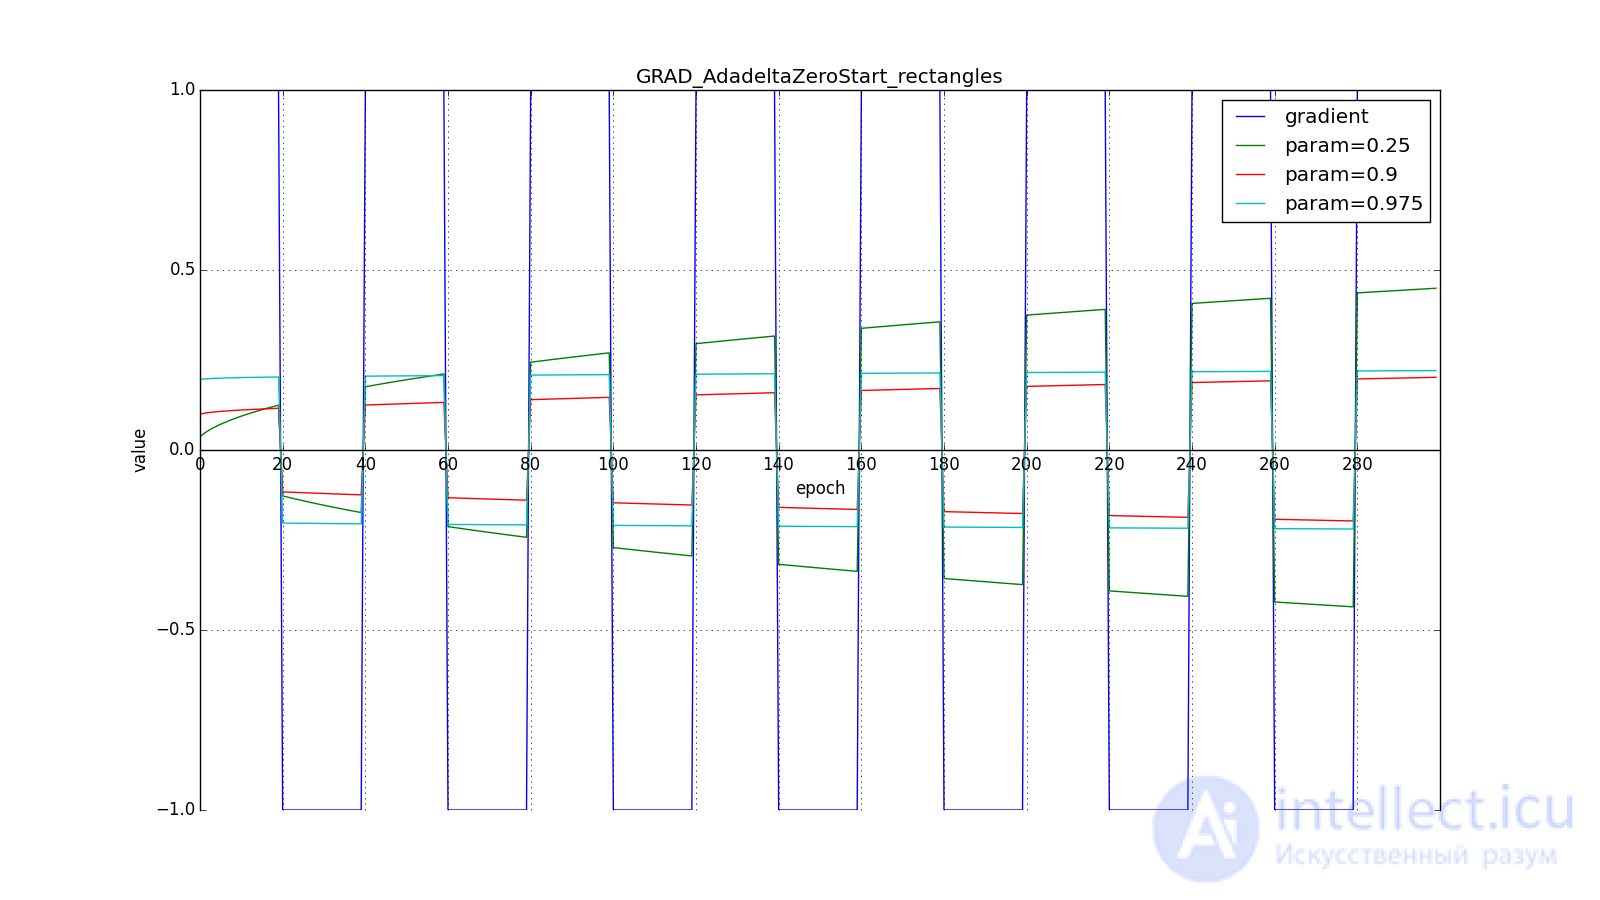
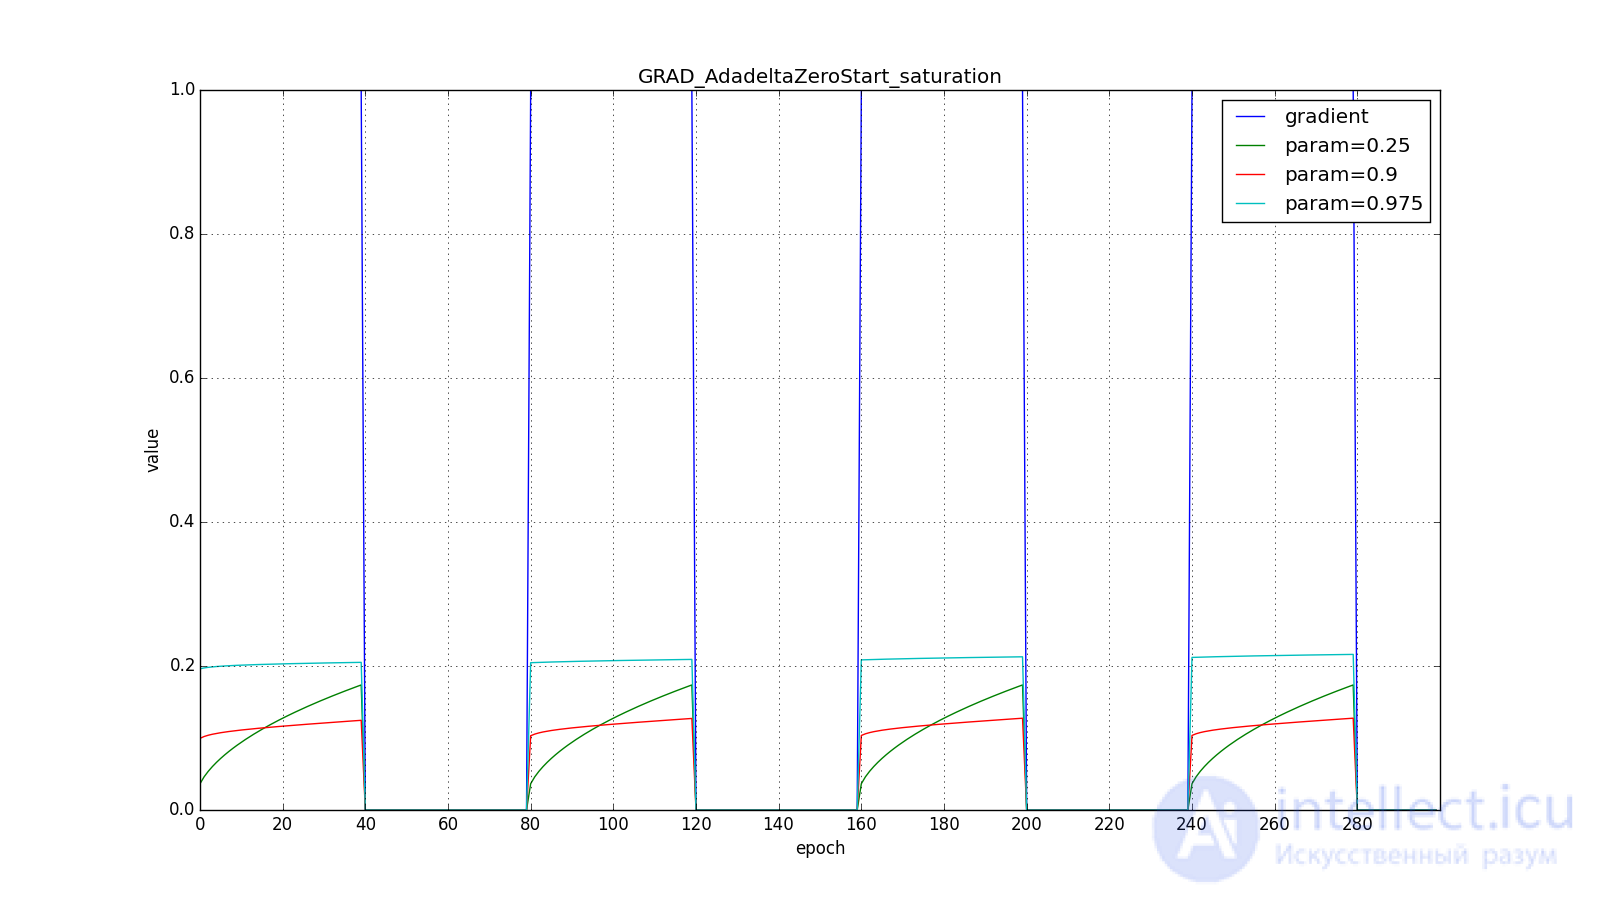
мы получим поведение, противоположное Adagrad и RMSProp: мы будем сильнее (до некоторого предела) обновлять веса, которые используются чаще . Ведь теперь чтобы
стал значимым, параметр должен накопить большую сумму в числителе дроби.
Вот графики для нулевого начального :
А вот для большого:
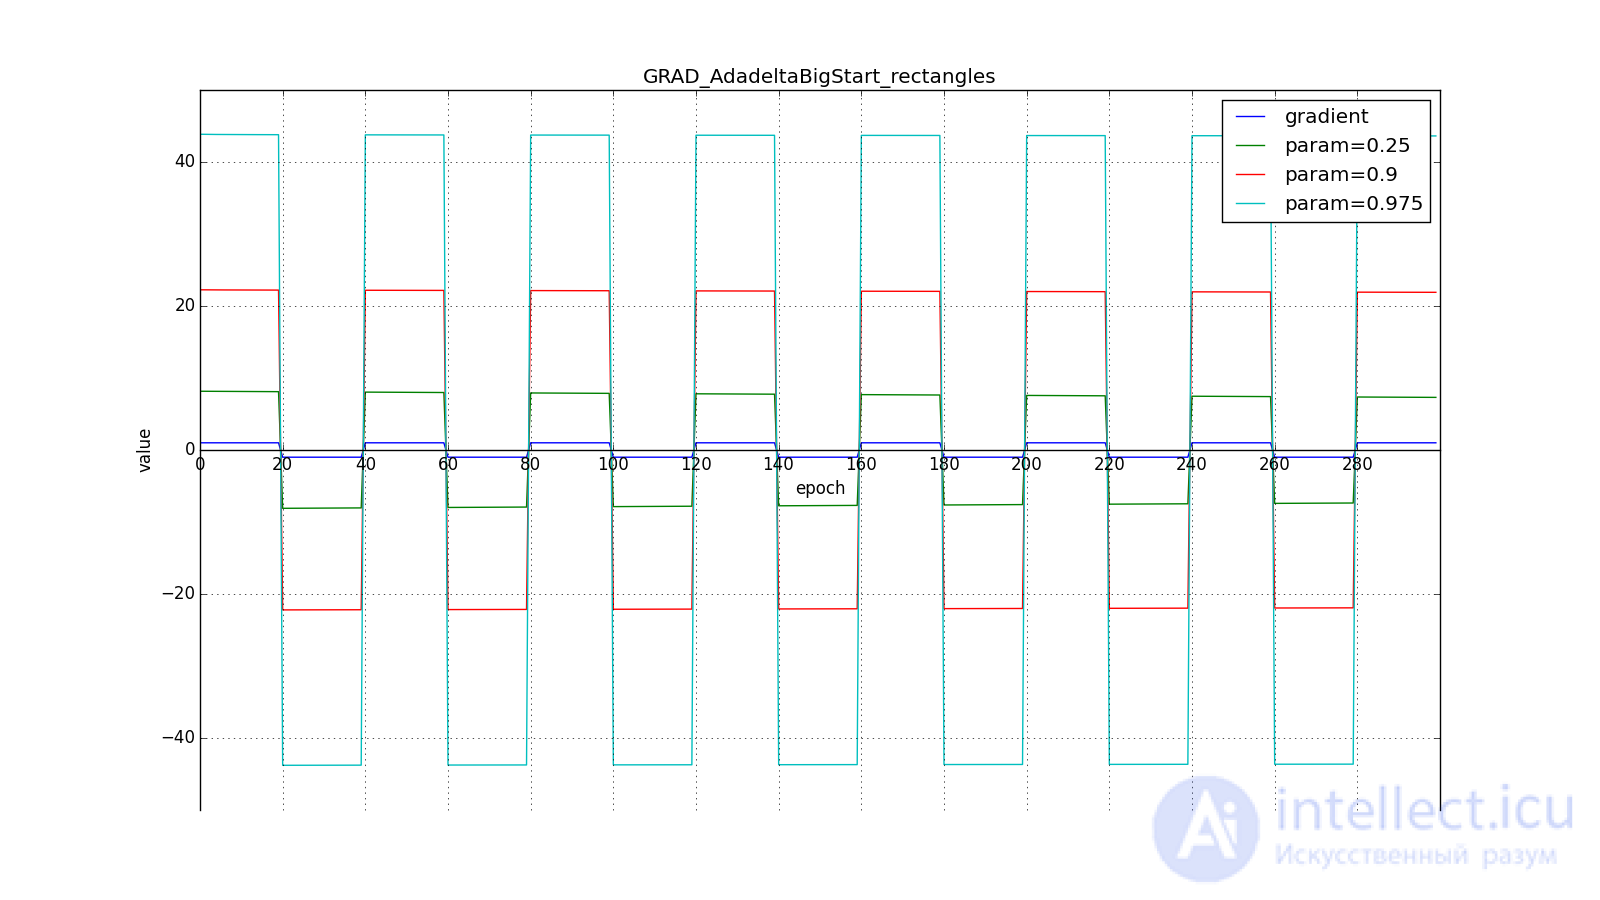
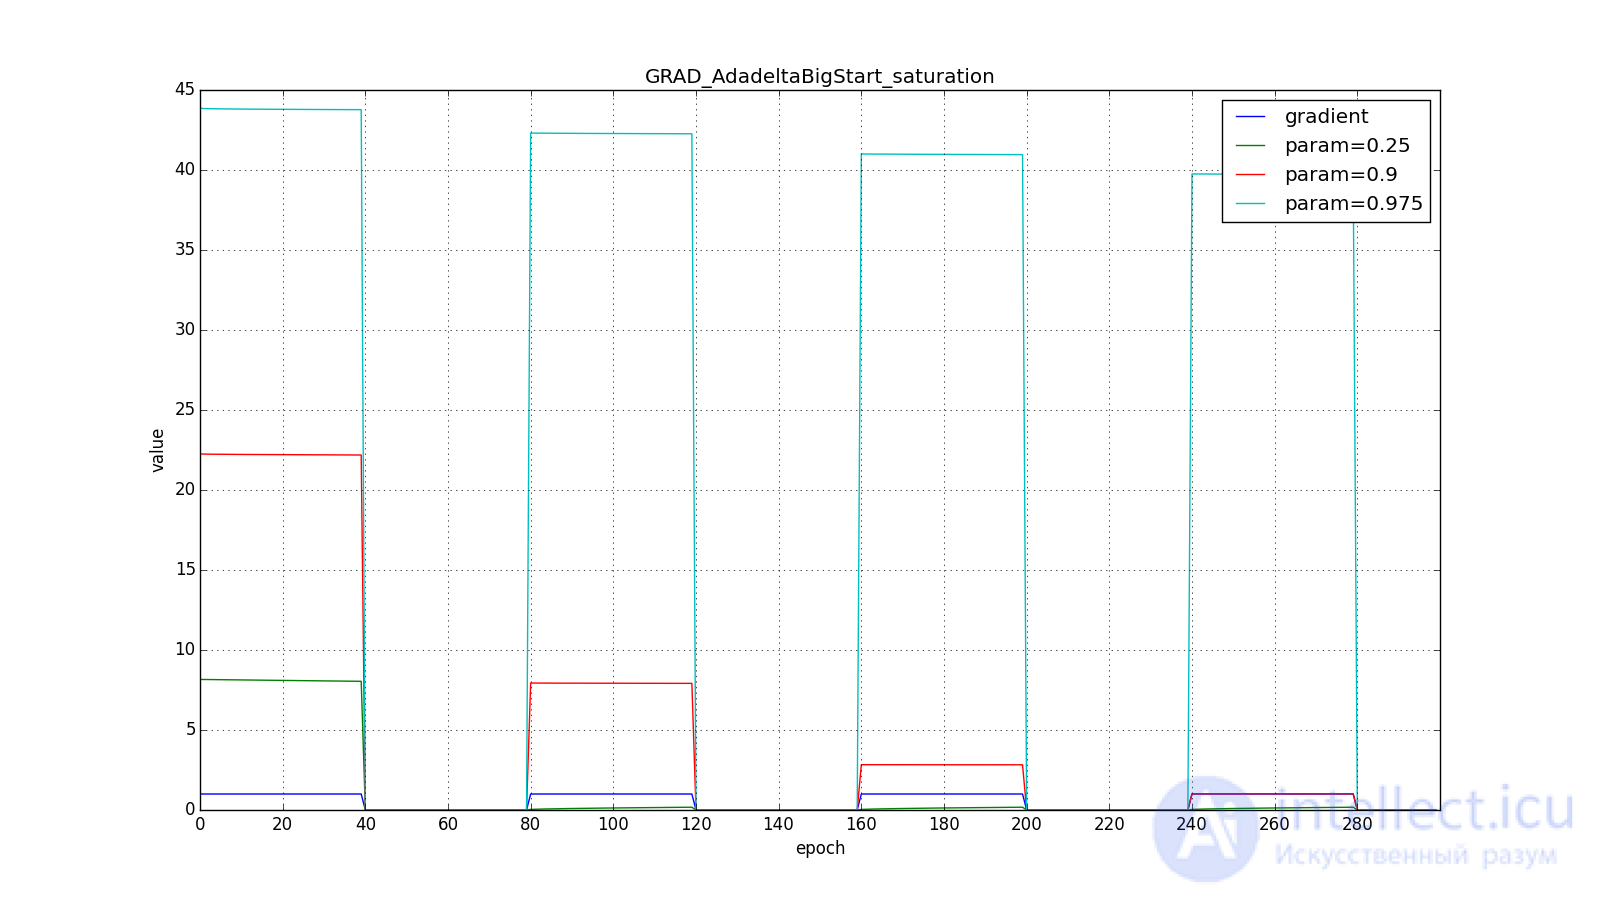
Впрочем, похоже, авторы алгоритма и добивались такого эффекта. Для RMSProp и Adadelta, как и для Adagrad не нужно очень точно подбирать скорость обучения — достаточно прикидочного значения. Обычно советуют начать подгон c
a
так и оставить
. Чем ближе
to
, тем дольше RMSProp и Adadelta с большим
будут сильно обновлять мало используемые веса. If
and
, то Adadelta будет долго «с недоверием» относиться к редко используемым весам. Последнее может привести к параличу алгоритма, а может вызвать намеренно «жадное» поведение, когда алгоритм сначала обновляет нейроны, кодирующие самые лучшие признаки.
Adam — adaptive moment estimation, ещё один оптимизационный алгоритм. Он сочетает в себе и идею накопления движения и идею более слабого обновления весов для типичных признаков. Снова вспомним (4):
От Нестерова Adam отличается тем, что мы накапливаем не , а значения градиента, хотя это чисто косметическое изменение, см. (23). Кроме того, мы хотим знать, как часто градиент изменяется. Авторы алгоритма предложили для этого оценивать ещё и среднюю нецентрированную дисперсию:
Легко заметить, что это уже знакомый нам , так что по сути тут нет отличий от RMSProp.
Важное отличие состоит в начальной калибровке and
: они страдают от той же проблемы, что и
в RMSProp: если задать нулевое начальное значение, то они будут долго накапливаться, особенно при большом окне накопления (
,
), а какие-то изначальные значения — это ещё два гиперпараметра. Никто не хочет ещё два гиперпараметра, так что мы искусственно увеличиваем
and
на первых шагах (примерно
for
and
for
)
В итоге, правило обновления:
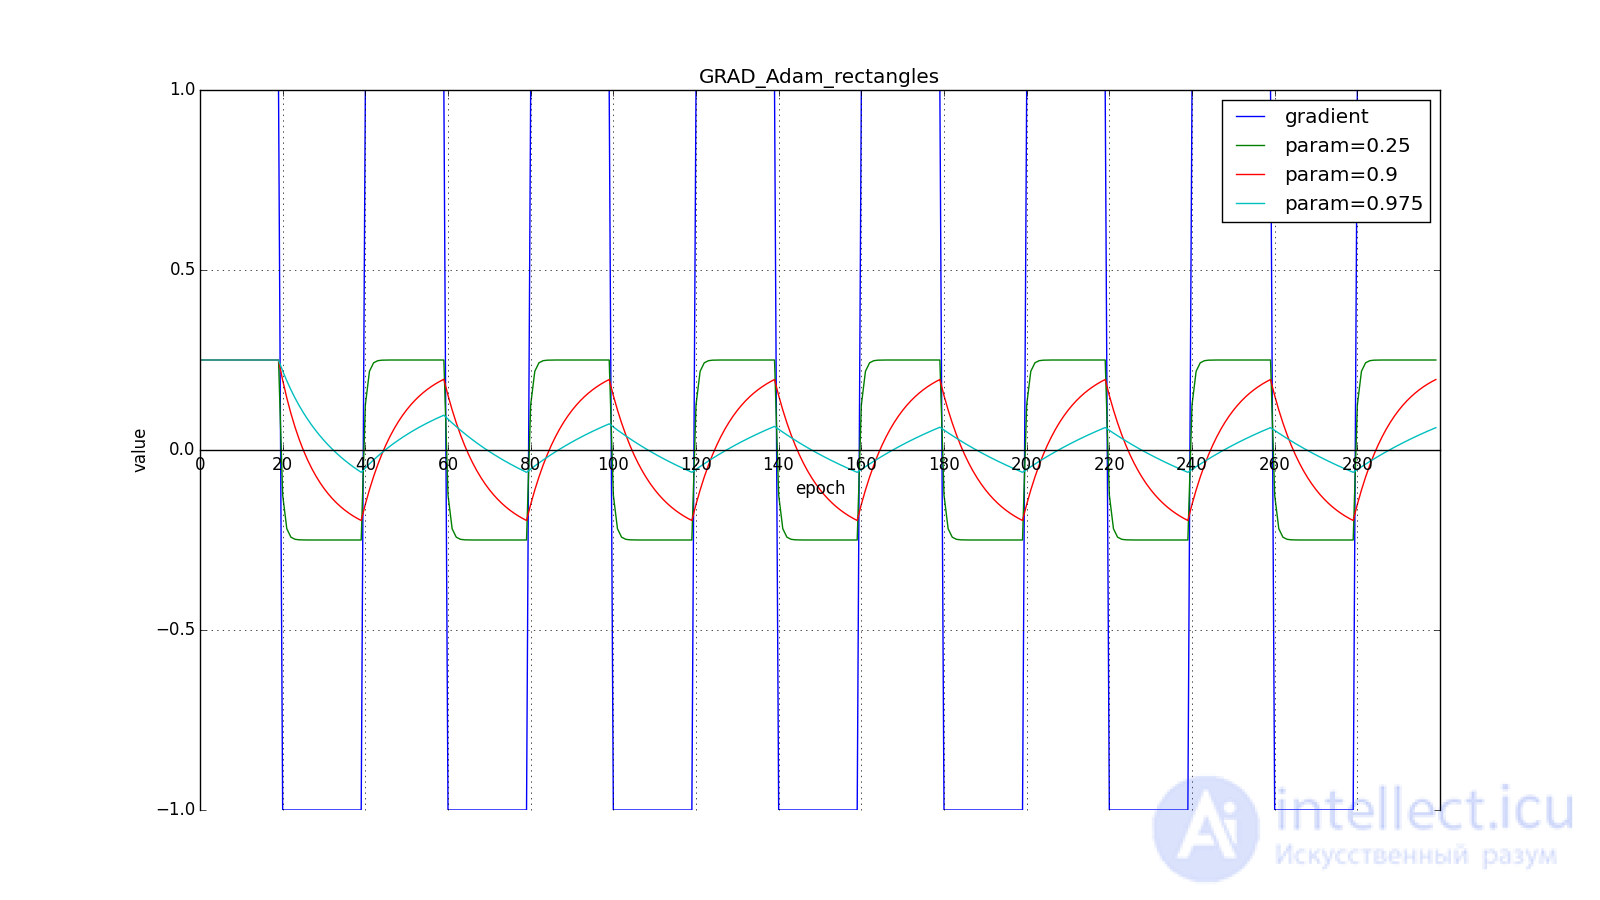
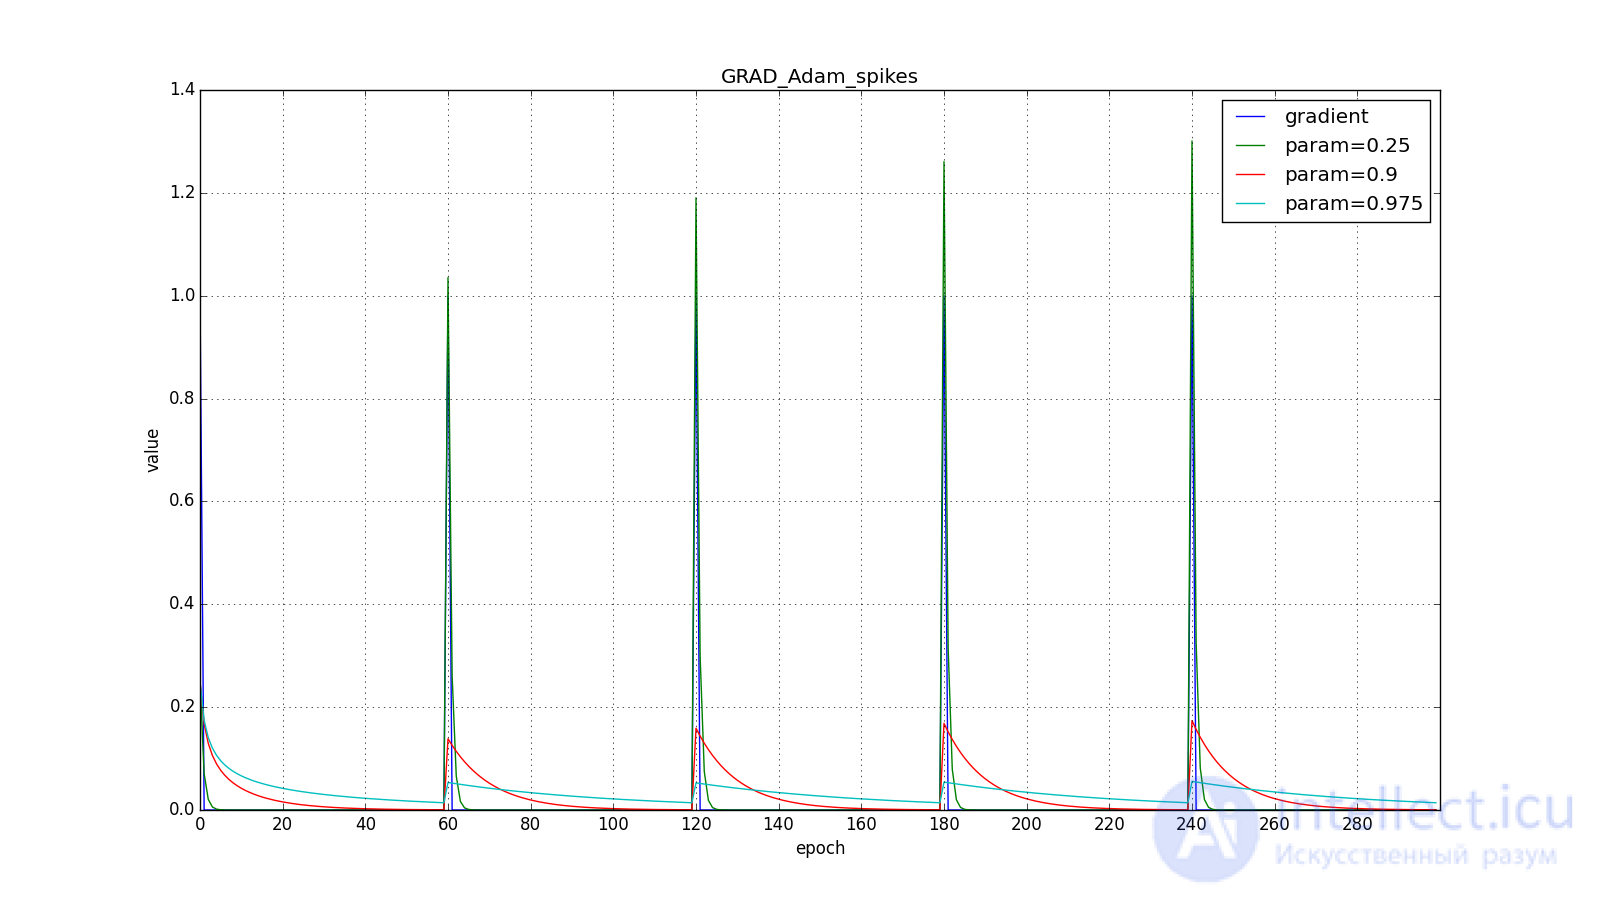
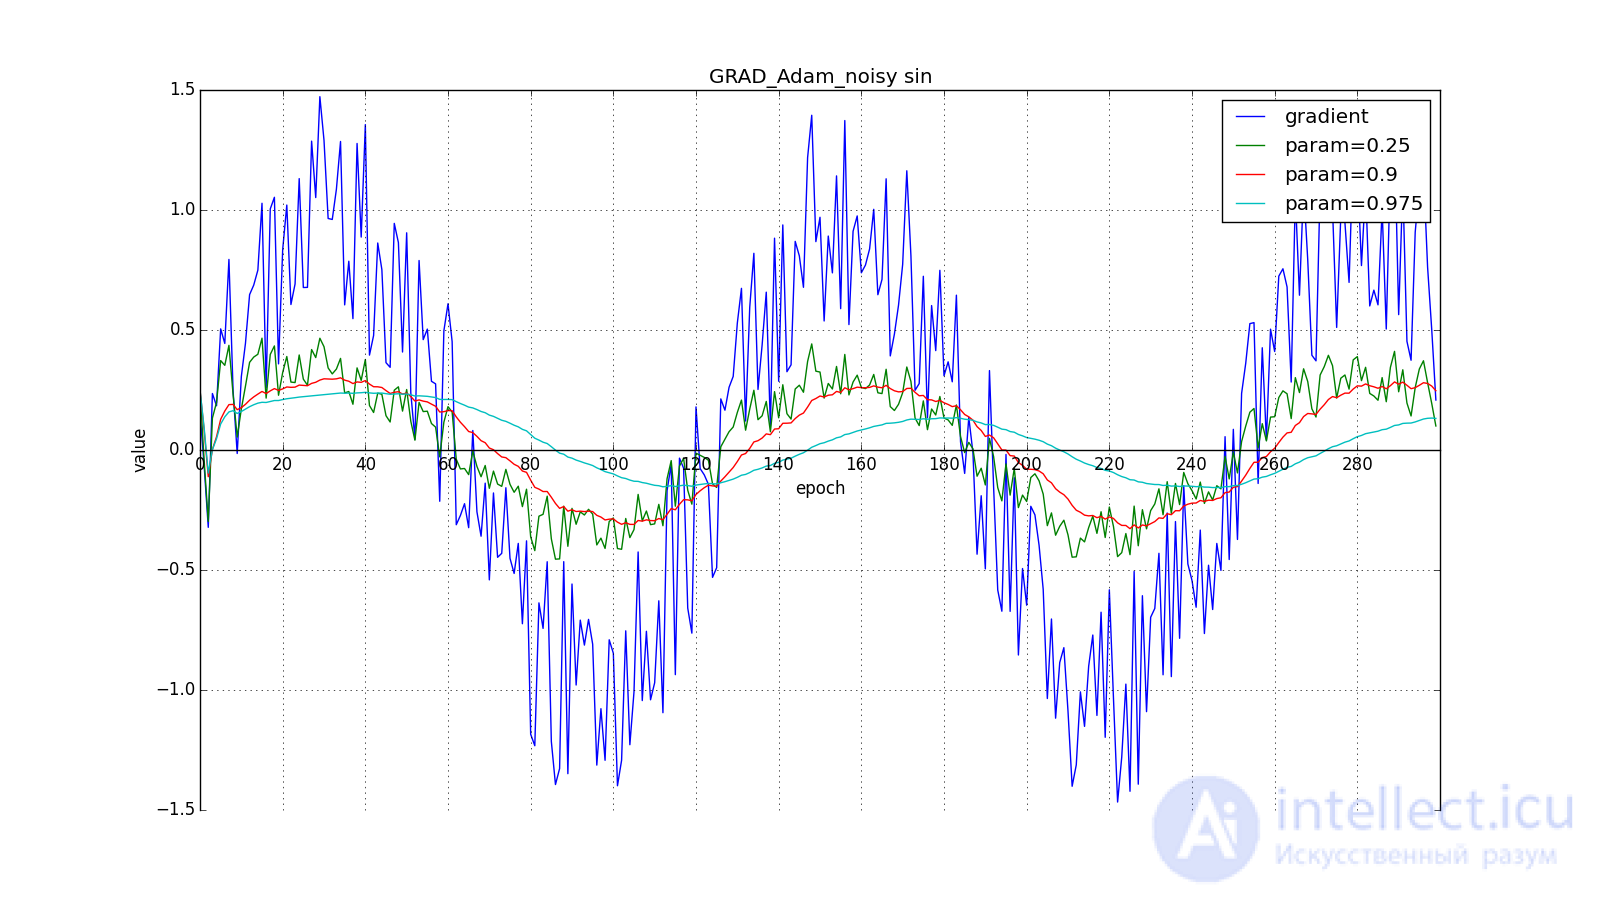
Здесь следует внимательно посмотреть на то, как быстро синхронизировались значения обновлений на первых зубцах графиков с прямоугольниками и на гладкость кривой обновлений на графике с синусом — её мы получили «бесплатно». При рекомендуемом параметре на графике с шипами видно, что резкие всплески градиента не вызывает мгновенного отклика в накопленном значении, поэтому хорошо настроенному Adam не нужен gradient clipping.
Авторы алгоритма выводят (22), разворачивая рекурсивные формулы (20) и (21). For example, for :
Term близко к
при стационарном распределении
, что неправда в практически интересующих нас случаях. но мы всё равно переносим скобку с
to the left. Неформально, можно представить что при
у нас бесконечная история одинаковых обновлений:
Когда же мы получаем более близкое к правильному значение , мы заставляем «виртуальную» часть ряда затухать быстрее:
Авторы Adam предлагают в качестве значений по умолчанию и утверждают, что алгоритм выступает лучше или примерно так же, как и все предыдущие алгоритмы на широком наборе датасетов за счёт начальной калибровки. Заметьте, что опять-таки, уравнения (22) не высечены в камне. У нас есть некоторое теоретическое обоснование, почему затухание должно выглядеть именно так, но никто не запрещает поэкспериментировать с формулами калибровки. На мой взгляд, здесь просто напрашивается применить заглядывание вперёд, как в методе Нестерова.
Adamax is just such an experiment proposed in the same article. Instead of dispersion in (21), we can assume the inertial moment of the distribution of gradients of arbitrary degree .This can lead to instability to the calculations. However, the case of
infinity tends to work surprisingly well.
Notice that instead using the appropriate dimension
. In addition, note that to use in the Adam formulas the value obtained in (27), it is required to extract the root from it:
. We derive a decisive rule in return (21), taking
by unfolding under the root
with the help of (27):
It happened because in total, (28) will dominate the largest term. Informally, you can intuitively understand why this happens by taking a simple sum and a large
:
. Not scary at all.
The remaining steps of the algorithm are the same as in Adam.
Now let's look at the different algorithms in action. To make it clearer, let's look at the trajectory of the algorithms in the problem of finding the minimum of a function of two variables. Let me remind you that the training of a neural network is essentially the same, but there are significantly more than two variables and instead of an explicitly specified function we have only a set of points along which we want to build this function. In our case, the loss function is the objective function along which the optimizers move. Of course, on such a simple task it is impossible to feel the full power of advanced algorithms, but it is intuitively clear.
First, let's look at the accelerated Nesterov gradient with different values . Understanding why this is the case, it is easier to understand the behavior of all other algorithms with accumulation of momentum, including Adam and Adamax.
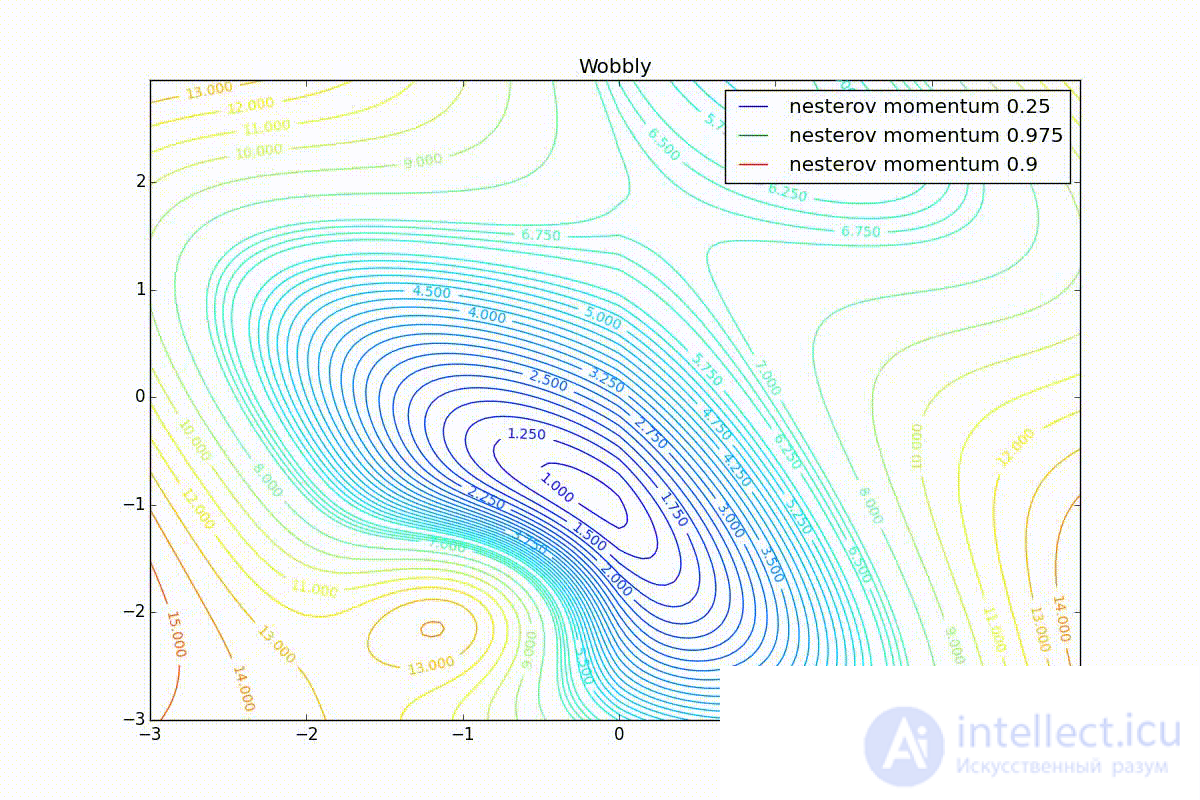
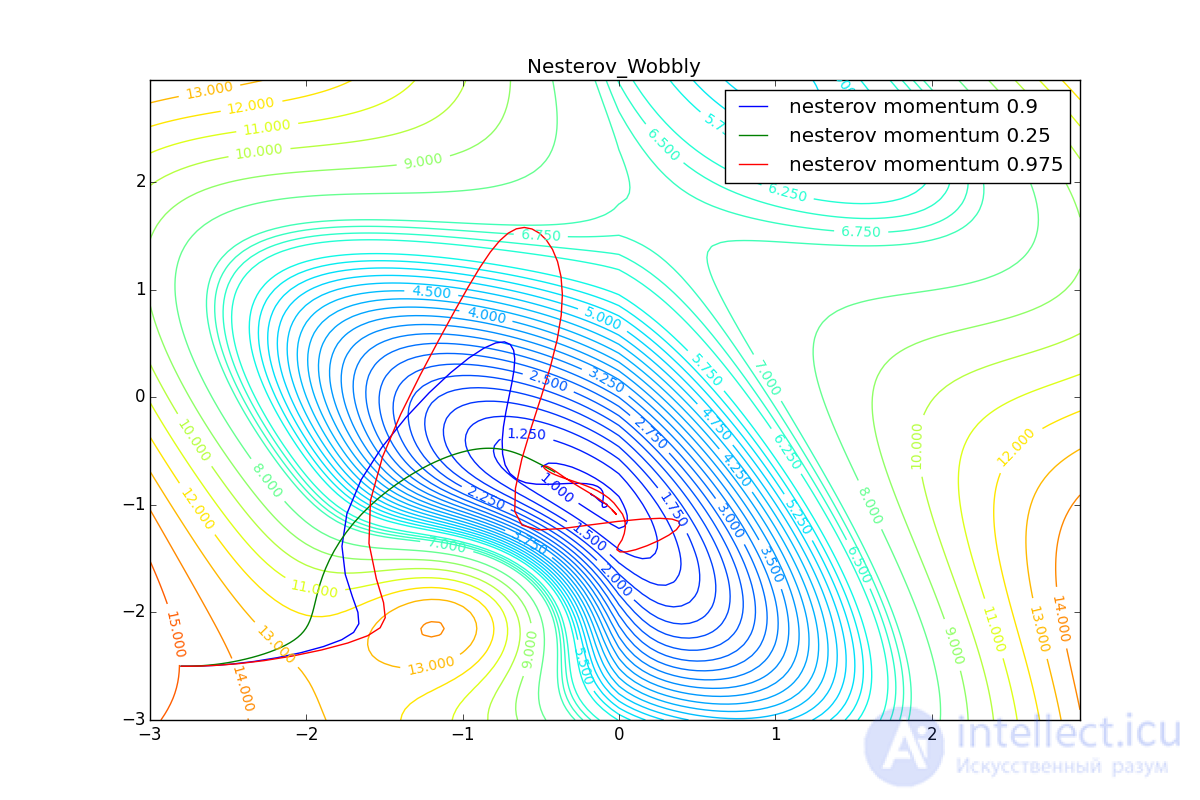
All trajectories end in the same pool, but they do it differently. Small the algorithm becomes similar to the usual SGD, at each step the descent goes in the direction of a decreasing gradient. With too much
, the prehistory of changes begins to strongly influence, and the trajectory can strongly “walk”. Sometimes this is good: the greater the accumulated impulse, the easier it is to break out of the hollows of local minima on the way.
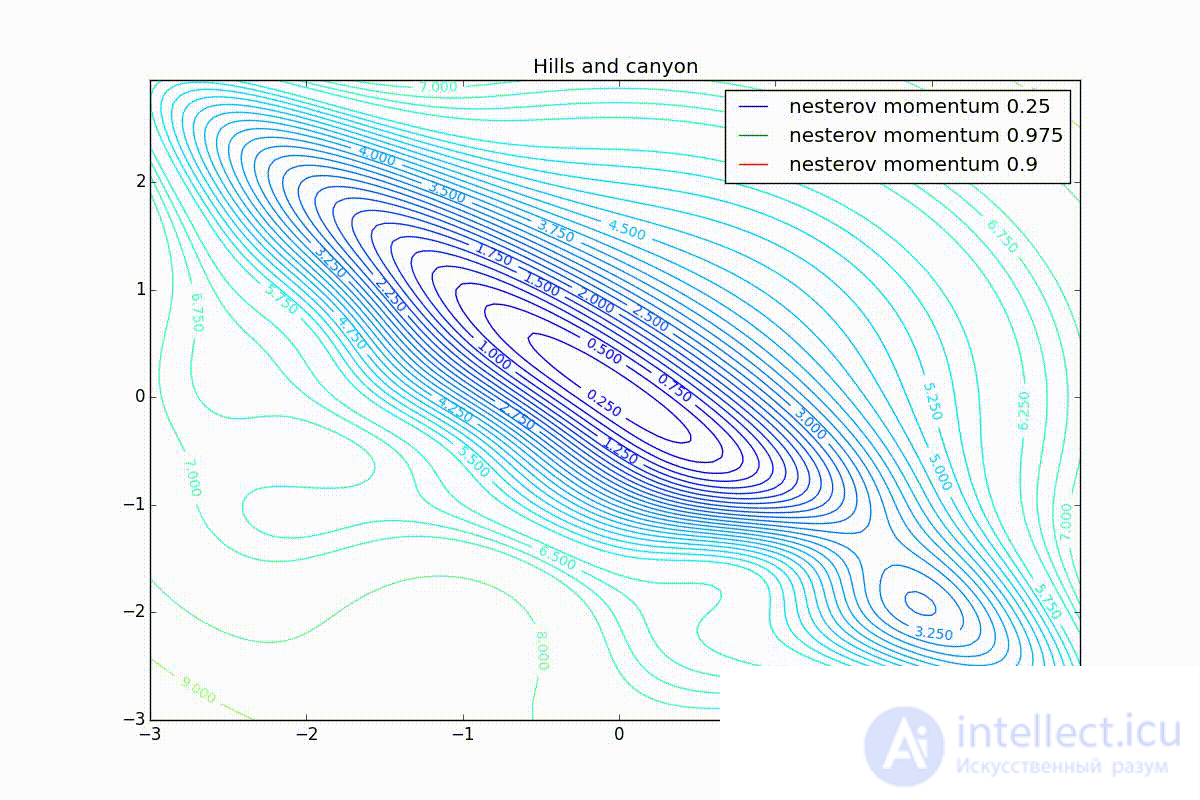
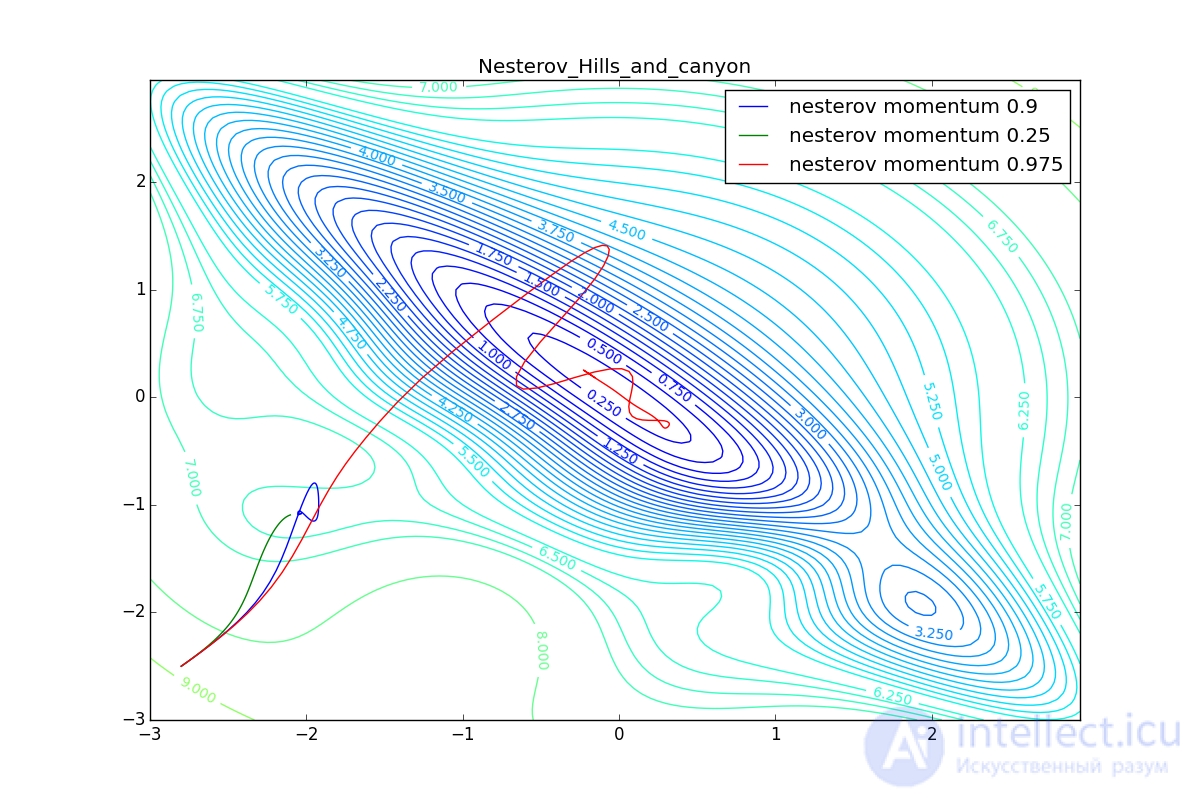
Sometimes bad: you can easily lose momentum by slipping into the hollow of the global minimum and settle in the local. Therefore, for large You can sometimes see how the losses in the training sample first reach the global minimum, then increase greatly, then begin to fall again, but they never return to the past minimum.
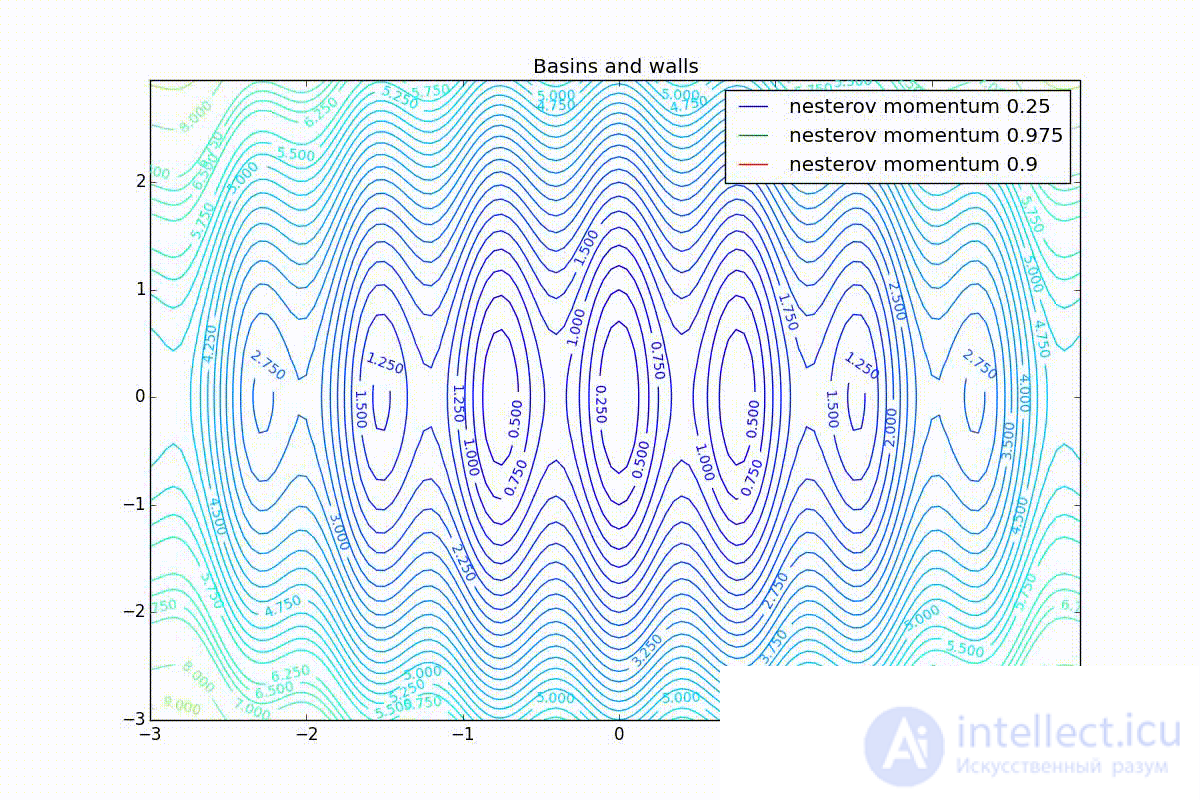
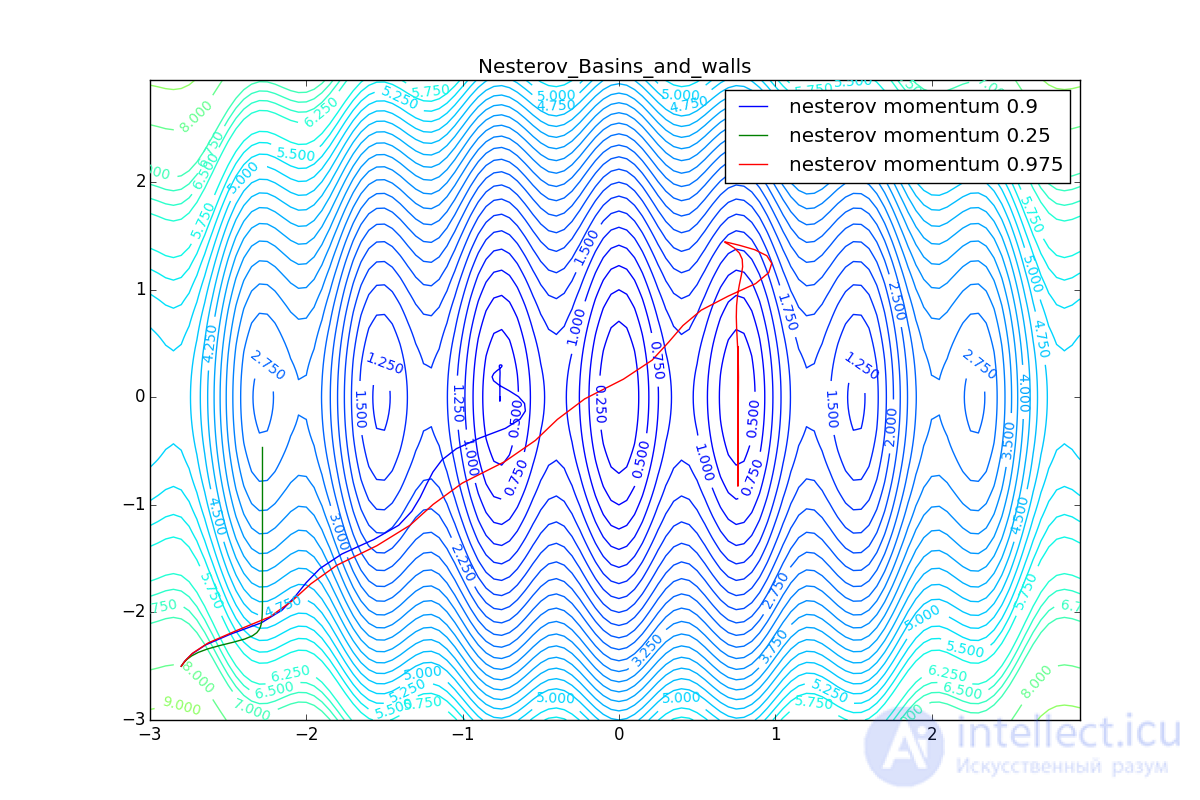
Now we will consider the different algorithms launched from one point.
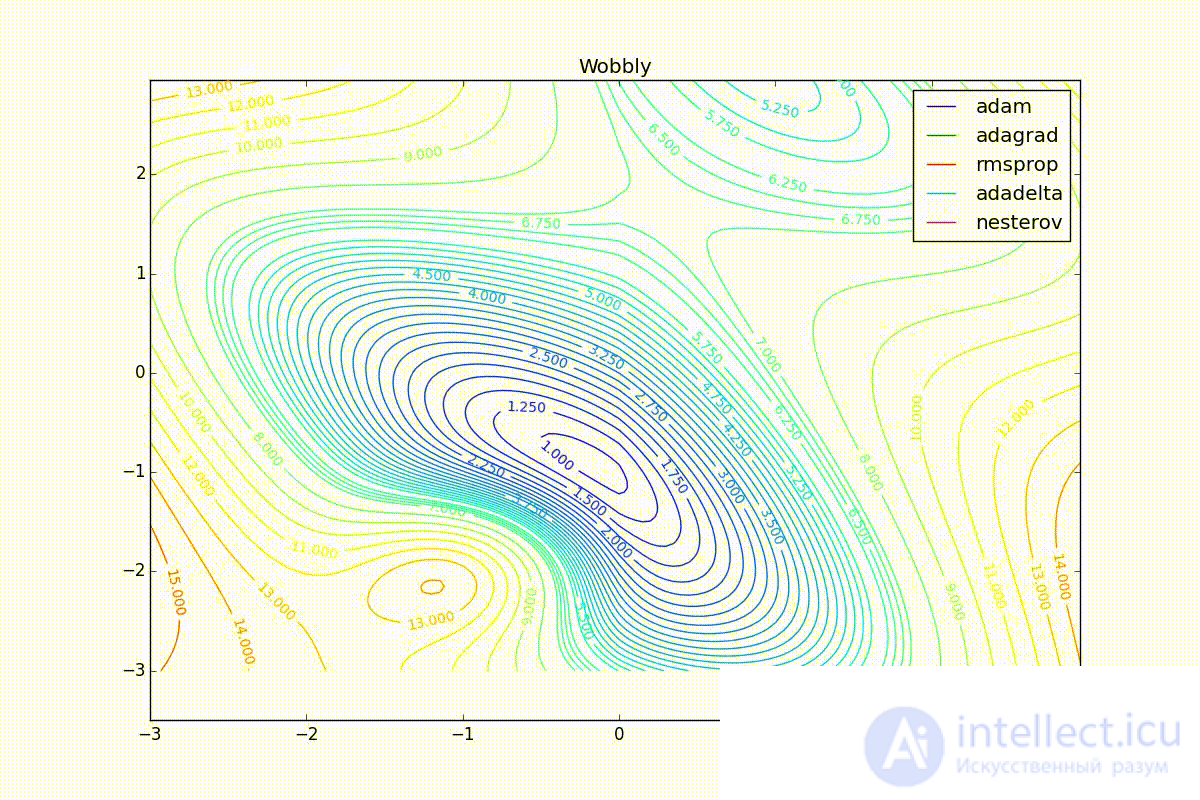
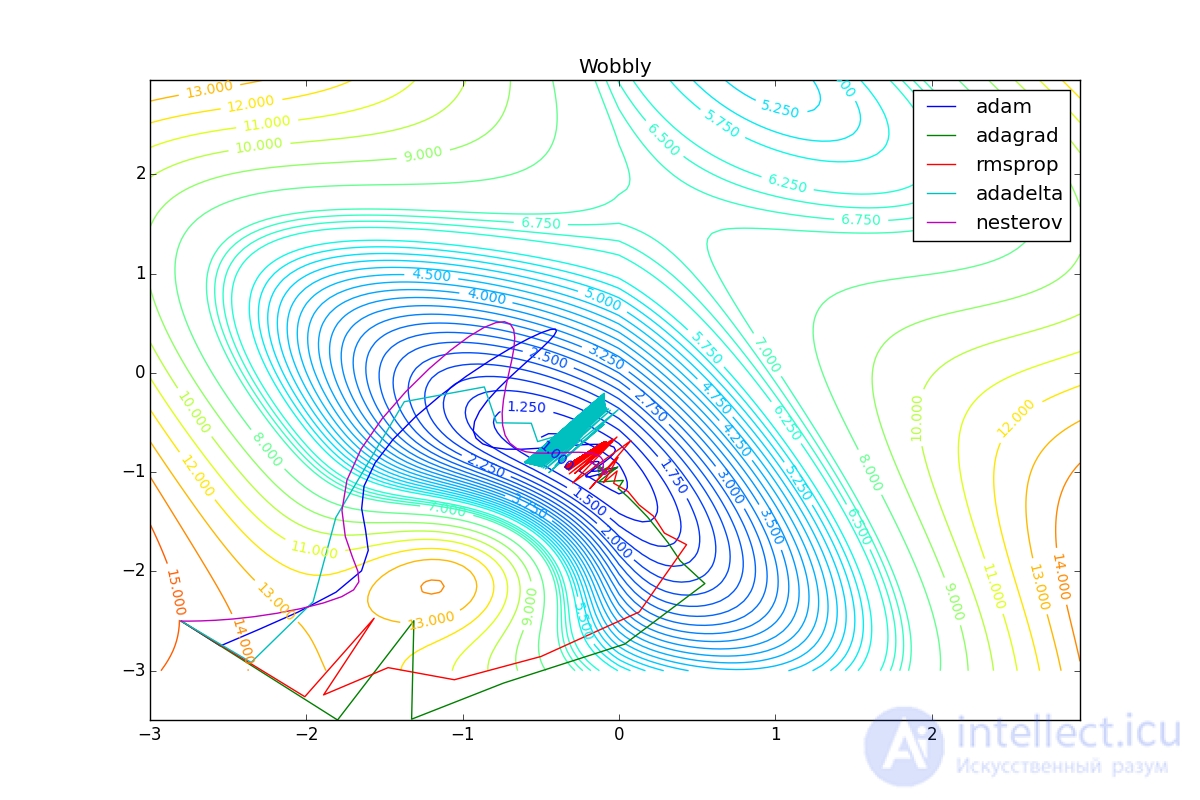
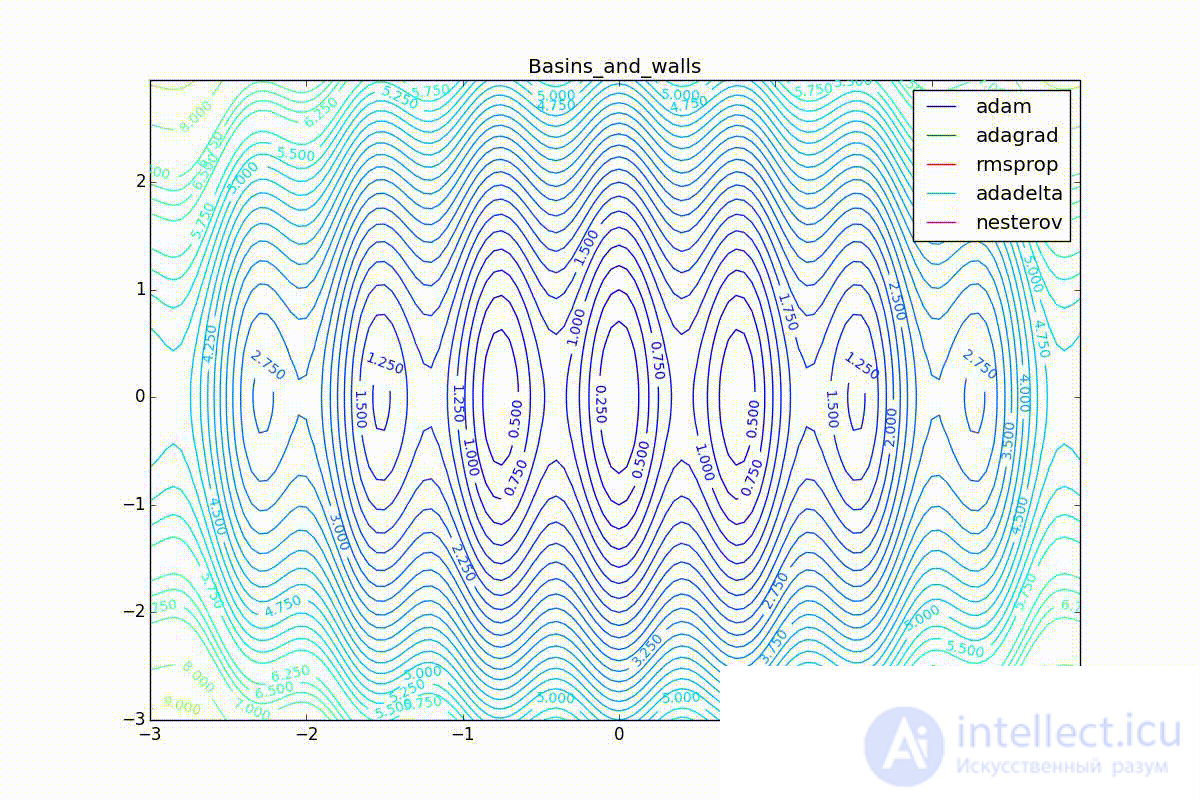
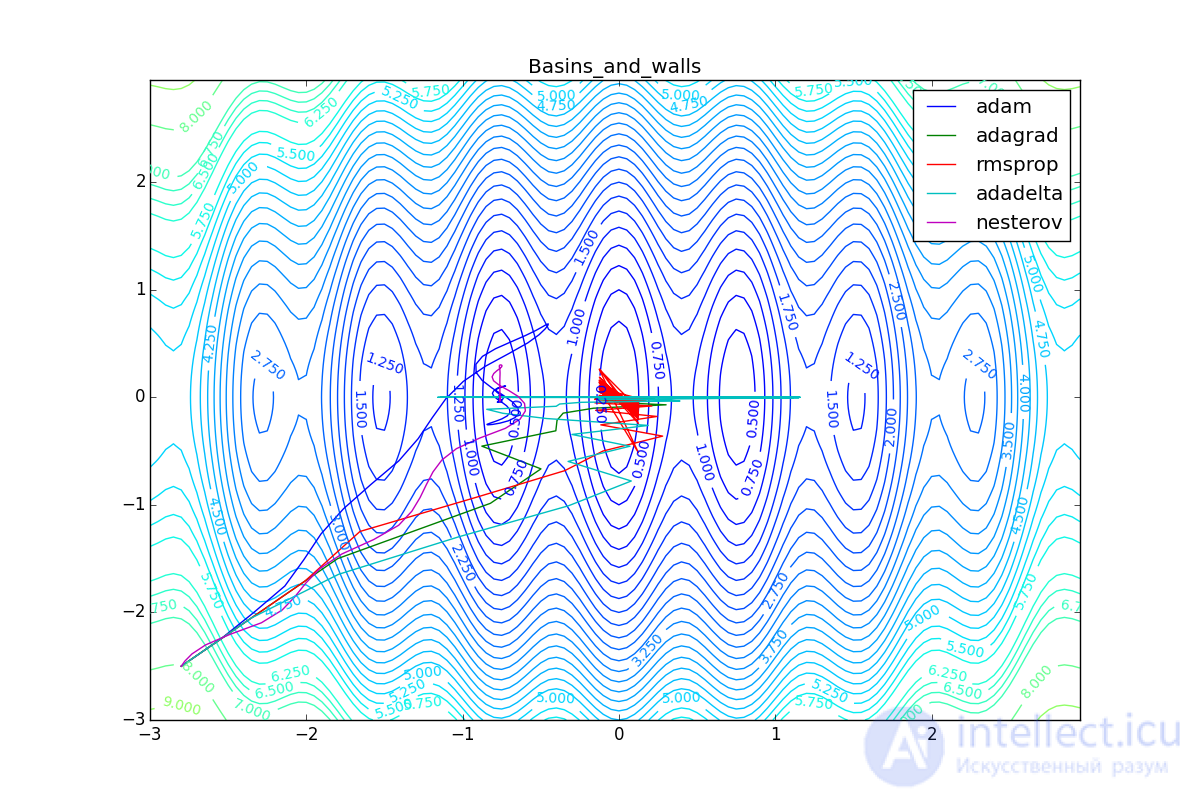
As you can see, they all agree quite well (with a minimum selection of learning speed). Pay attention to the big steps that Adam and RMSProp take at the start of training. This happens because from the very beginning there were no such changes in any parameter (in one coordinate) and the sums in the denominators (14) and (23) are equal to zero. Here the situation is more complicated:
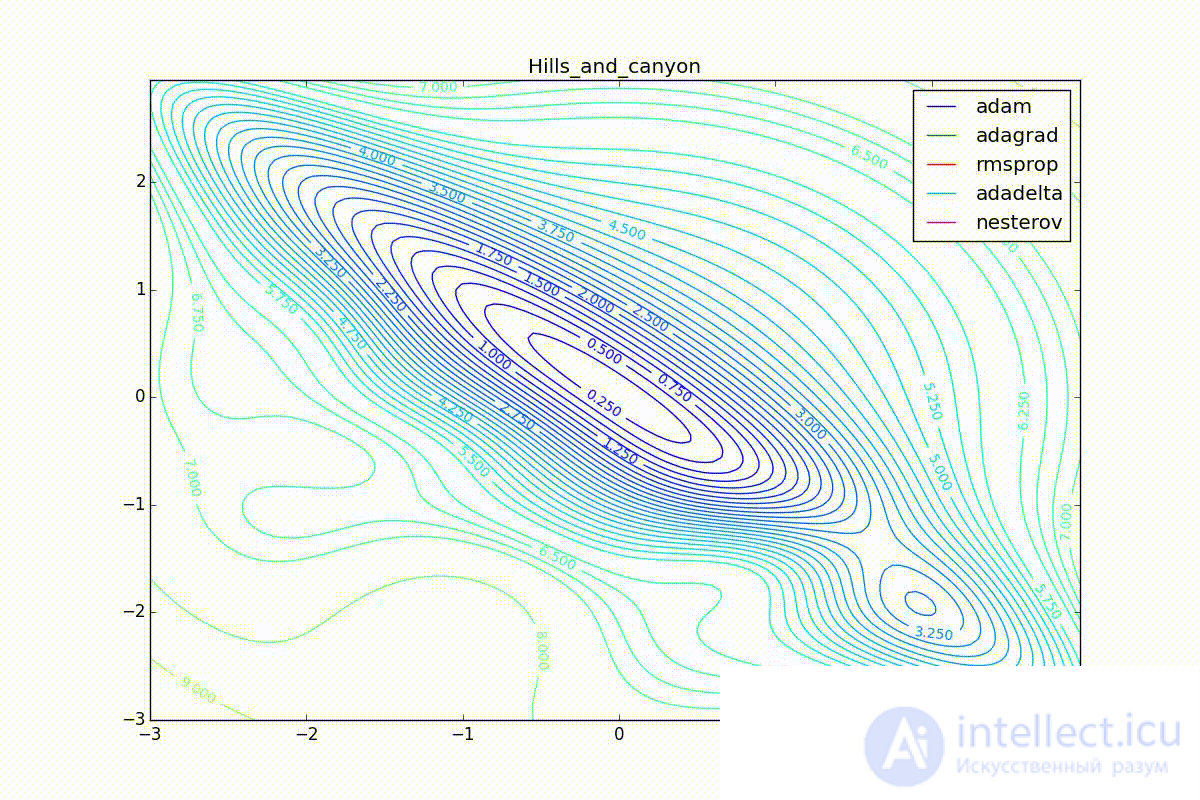
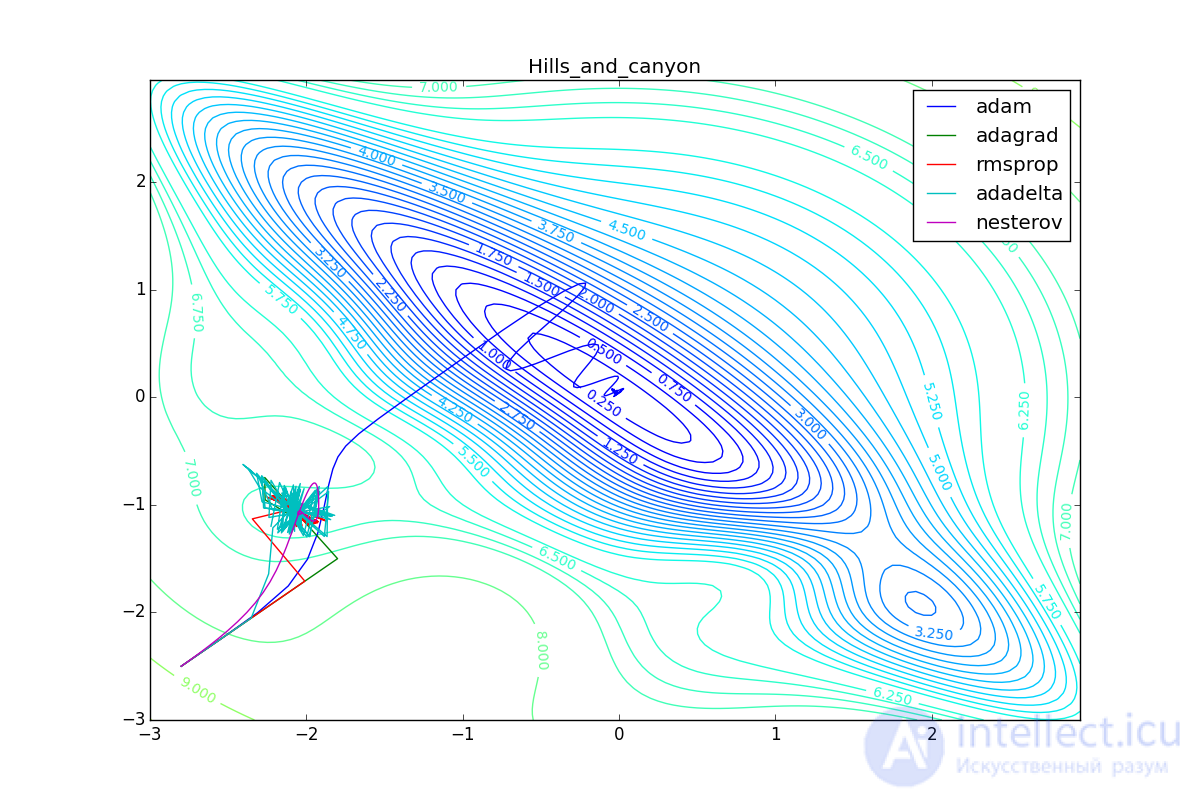
Besides Adam, everyone was locked in a local minimum. Compare the behavior of the Nesterov method and, say, RMSProp on these graphs. Accelerated Nesterov gradient, with any , hitting a local minimum, whirl around for a while, then loses momentum and fades at some point. RMSProp draws characteristic hedgehogs. This is also related to the sum in the denominator (14) - the gradient squares are small in the trap and the denominator becomes small again. The magnitude of the jumps is still influenced by the learning speed
the more jumps) and
(the less, the more). Adagrad does not show this behavior, since this algorithm has a sum over the entire history of gradients, and not over a window. This is usually the desired behavior, it allows you to jump out of the traps, but occasionally in this way the algorithm escapes from the global minimum, which again, leads to an irreparable deterioration in the performance of the algorithm on the training sample.
Finally, note that even though all these optimizers can find a way to a minimum even on a plateau with a very small incline or escape from a local minimum, if they have already gained momentum before, a bad starting point leaves them no chance:
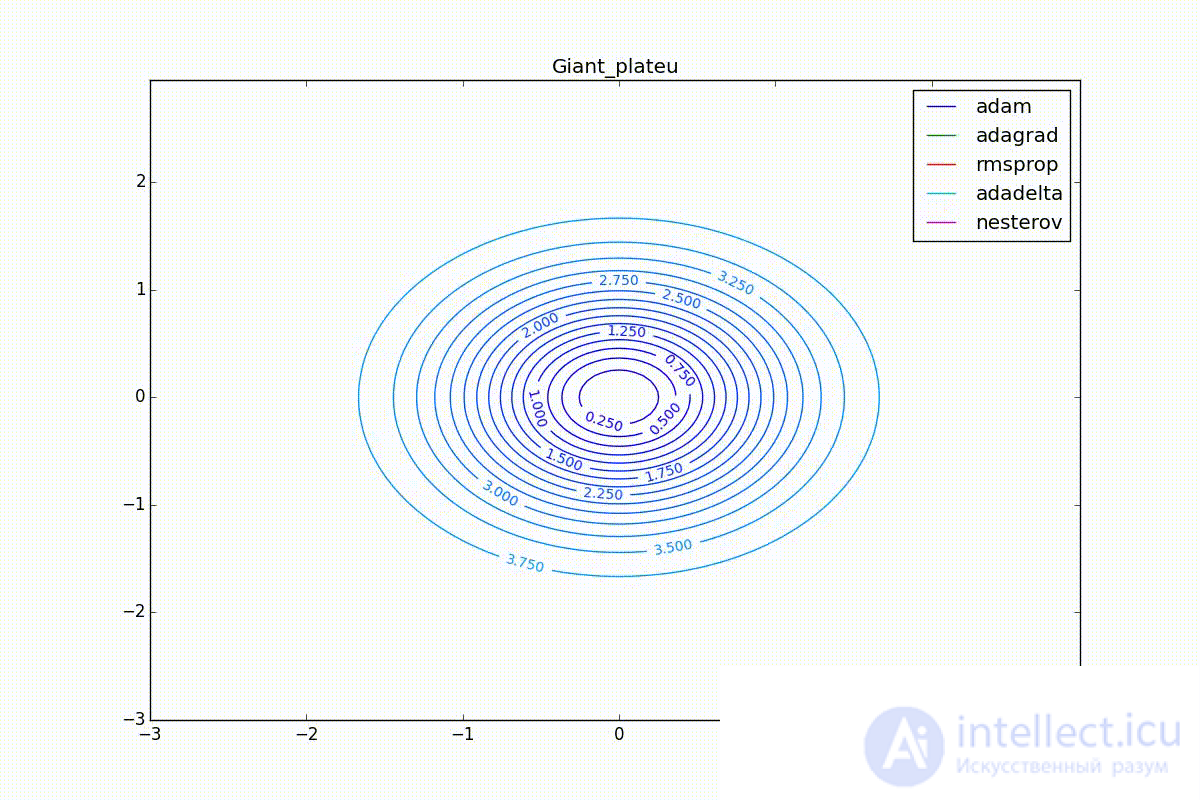
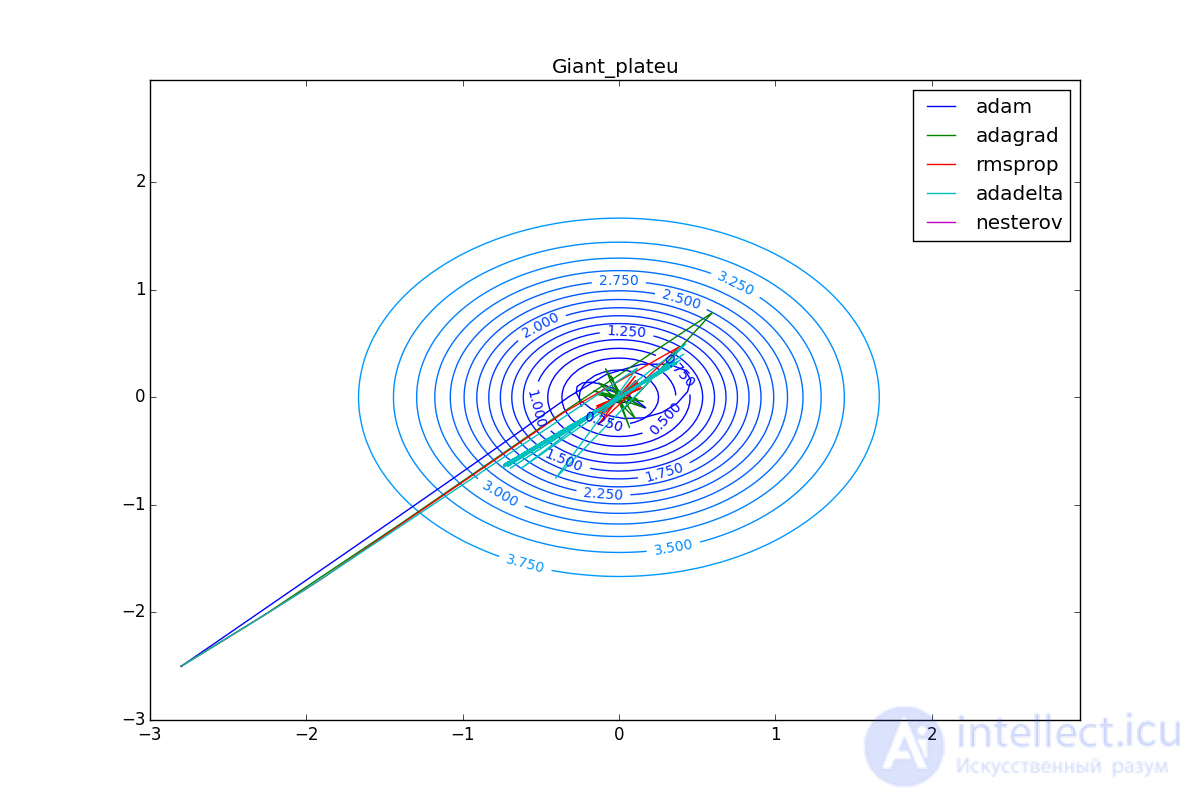
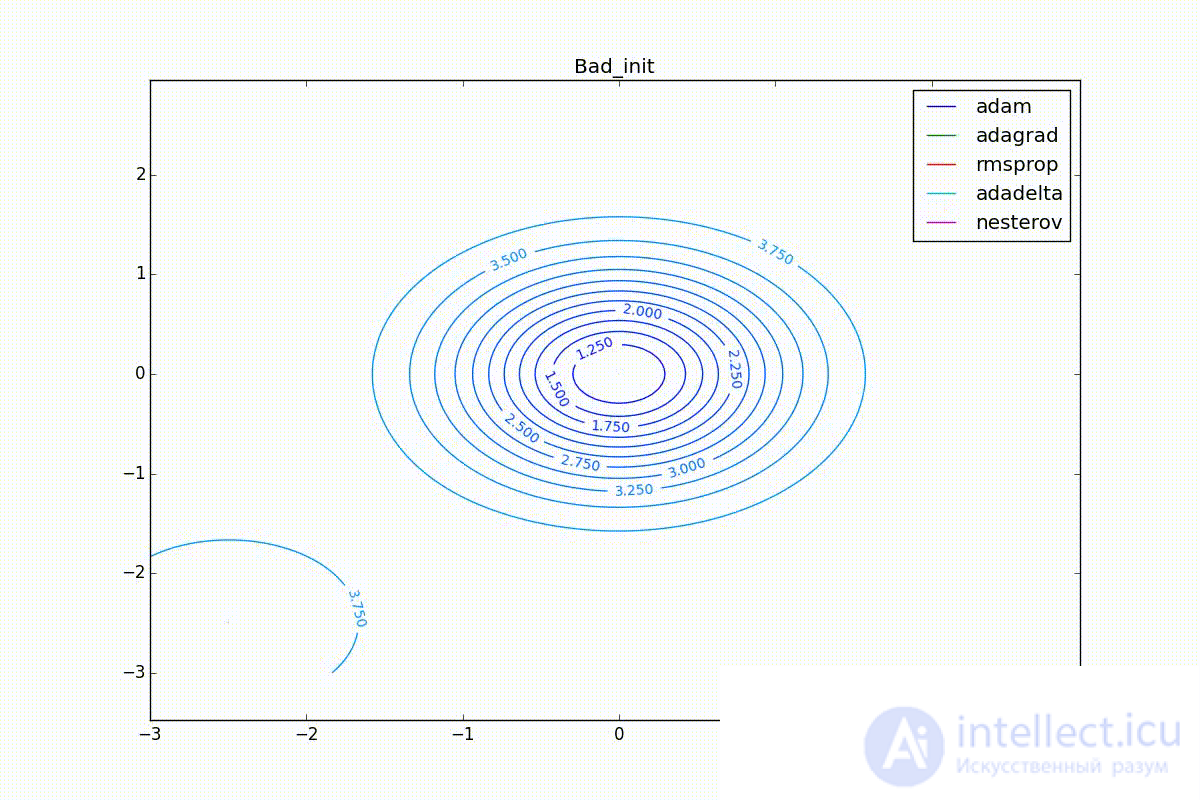
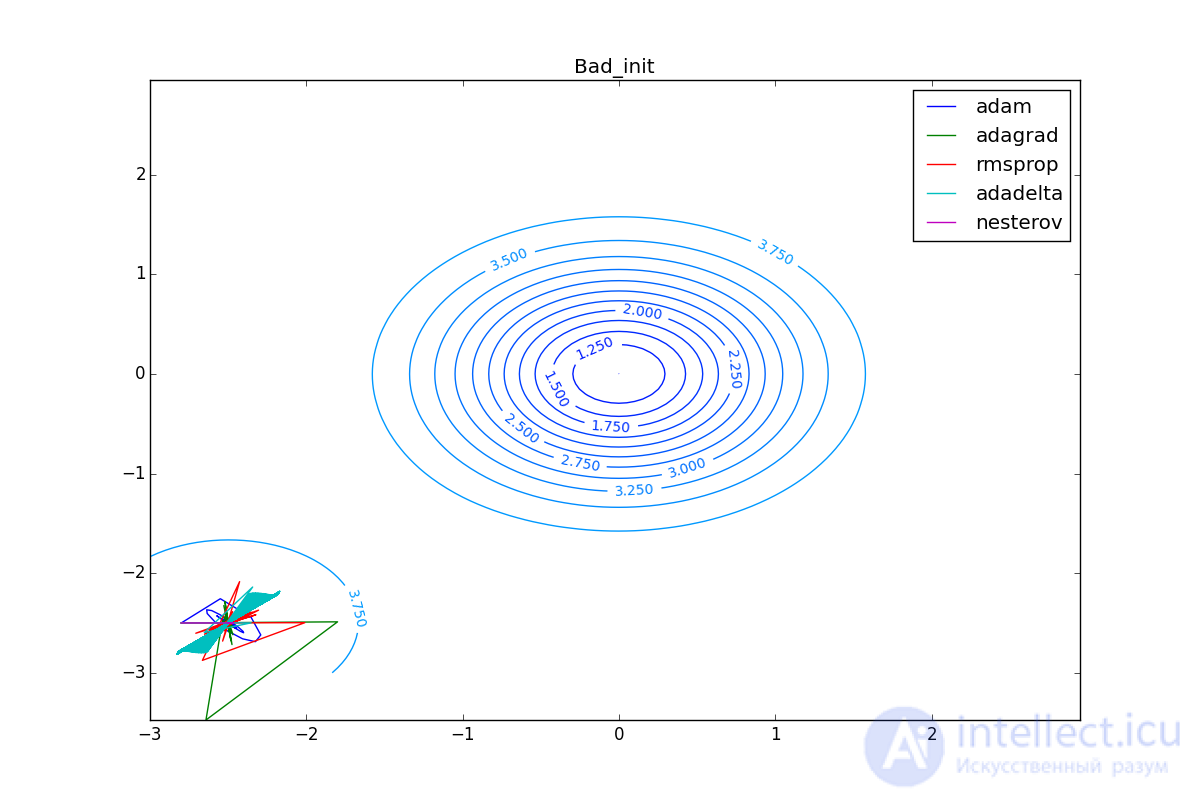
So, we have reviewed several of the most popular first-order neural network optimizers. I hope these algorithms have ceased to seem like a magical black box with a bunch of mysterious parameters, and now you can make an informed decision on which optimizer to use in your tasks.
Finally, I will clarify one important point: it is unlikely that changing the algorithm for updating the weights will solve all your problems with a neural network with one vzhuho. Of course, the increase in the transition from SGD to something else will be obvious, but most likely the learning history for the algorithms described in the article will look something like this for relatively simple data networks and network structures:
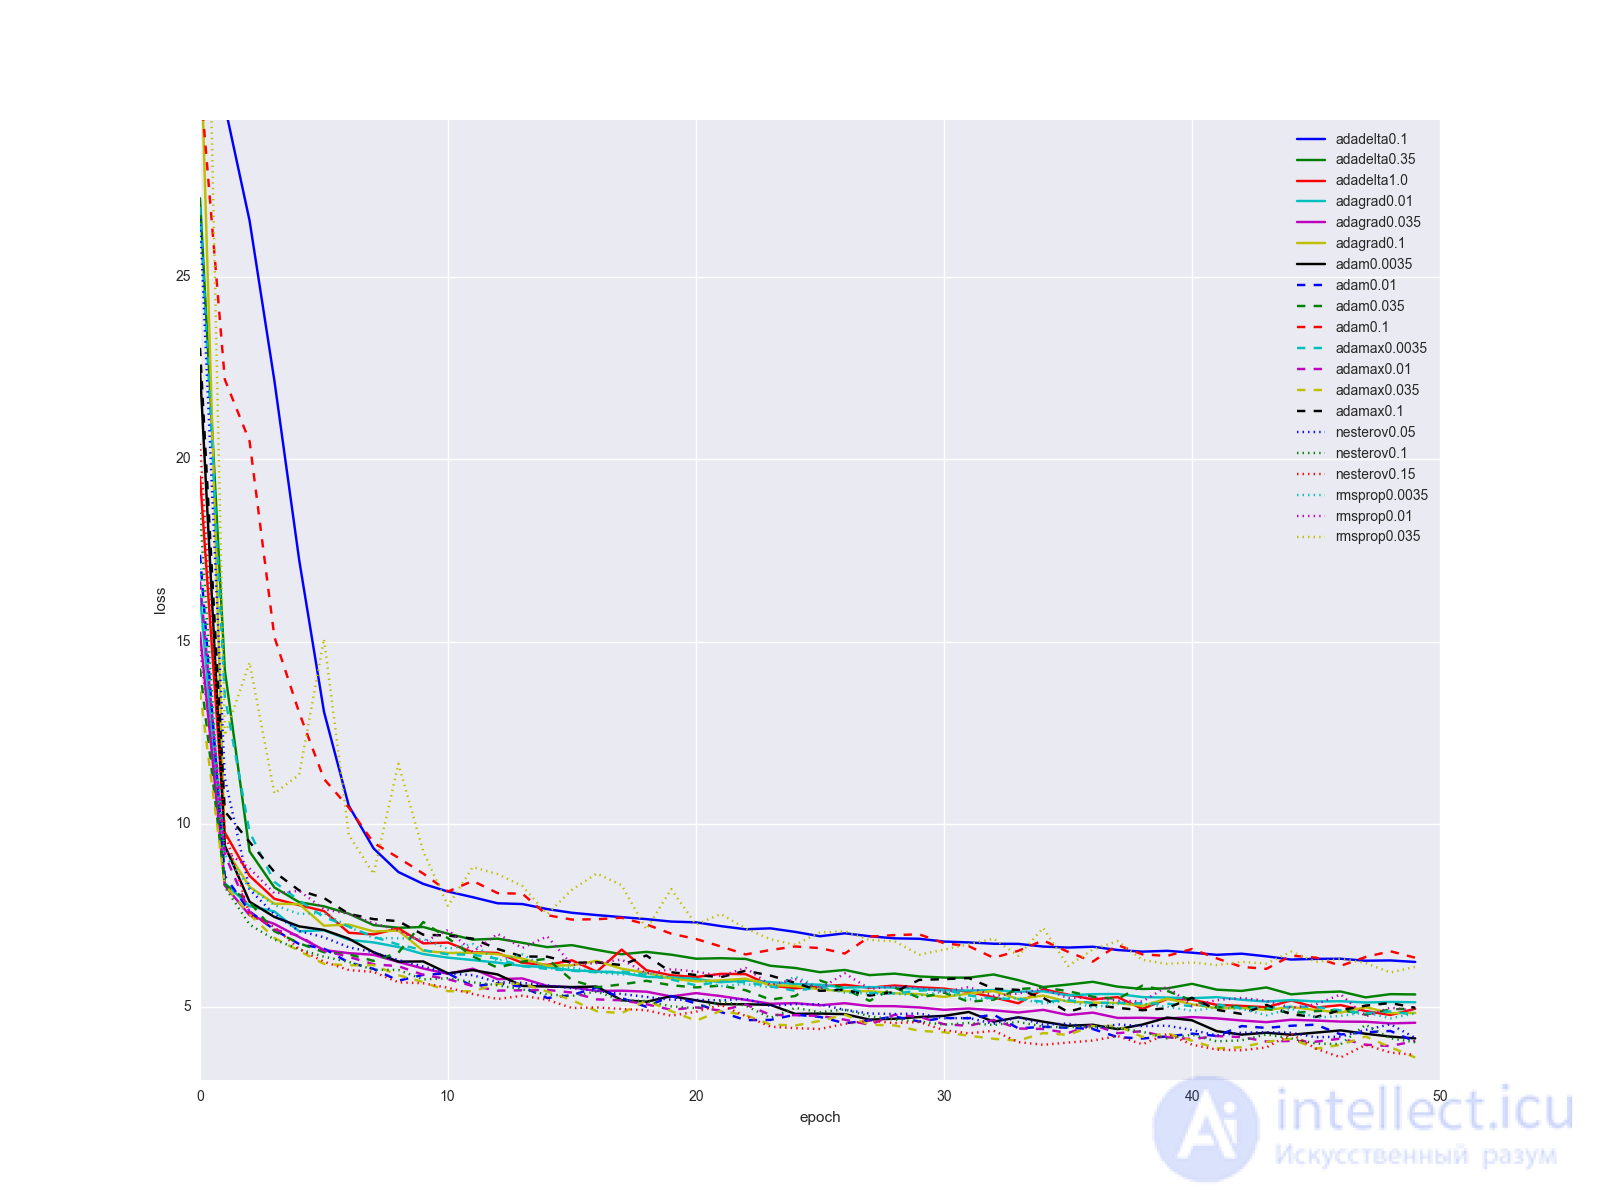
... not too impressive. I would suggest keeping the quality of Adam's “golden hammer”, as it gives the best results with minimal fitting of parameters. When the network is already more or less debugged, try the Nesterov method with different parameters. Sometimes with the help of it you can achieve better results, but it is relatively sensitive to changes in the network. Plus or minus a couple of layers and you need to look for a new optimal learning rate. Consider the remaining algorithms and their parameters as a few more knobs and toggle switches that can be pulled in some special cases.
If you want some custom graphs with gradients, use this python script (requires python> 3.4, numpy and matplotlib):
Code
from matplotlib import pyplot as plt
import numpy as np
from math import ceil, floor

def linear_interpolation(X, idx):
    idx_min = floor(idx)
    idx_max = ceil(idx)
    if idx_min == idx_max or idx_max >= len(X):
        return X[idx_min]
    elif idx_min < 0:
        return X[idx_max]
    else:
        return X[idx_min] + (idx - idx_min)*X[idx_max]

def EDM(X, gamma, lr=0.25):
    Y = []
    v = 0
    for x in X:
        v = gamma*v + lr*x
        Y.append(v)
    return np.asarray(Y)

def NM(X, gamma, lr=0.25):
    Y = []
    v = 0
    for i in range(len(X)):
        v = gamma*v + lr*(linear_interpolation(X, i+gamma*v) if i+gamma*v < len(X) else 0)
        Y.append(v)
    return np.asarray(Y)

def SmoothedNM(X, gamma, lr=0.25):
    Y = []
    v = 0
    for i in range(len(X)):
        lookahead4 = linear_interpolation(X, i+gamma*v/4)   if i+gamma*v/4      < len(X) else 0
        lookahead3 = linear_interpolation(X, i+gamma*v/2)   if i+gamma*v/2      < len(X) else 0
        lookahead2 = linear_interpolation(X, i+gamma*v*3/4) if i+gamma*v*3/4    < len(X) else 0
        lookahead1 = linear_interpolation(X, i+gamma*v)     if i+gamma*v        < len(X) else 0
        v = gamma*v + lr*(lookahead4 + lookahead3 + lookahead2 + lookahead1)/4
        Y.append(v)
    return np.asarray(Y)

def Adagrad(X, eps, lr=2.5):
    Y = []
    G = 0
    for x in X:
        G += x*x
        v = lr/np.sqrt(G + eps)*x
        Y.append(v)
    return np.asarray(Y)

def RMSProp(X, gamma, lr=0.25, eps=0.00001):
    Y = []
    EG = 0
    for x in X:
        EG = gamma*EG + (1-gamma)*x*x
        v = lr/np.sqrt(EG + eps)*x
        Y.append(v)
    return np.asarray(Y)

def Adadelta(X, gamma, lr=50.0, eps=0.001):
    Y = []
    EG = 0
    EDTheta = lr
    for x in X:
        EG = gamma*EG + (1-gamma)*x*x
        v = np.sqrt(EDTheta + eps)/np.sqrt(EG + eps)*x
        Y.append(v)
        EDTheta = gamma*EDTheta + (1-gamma)*v*v
    return np.asarray(Y)

def AdadeltaZeroStart(X, gamma, eps=0.001):
    return Adadelta(X, gamma, lr=0.0, eps=eps)

def AdadeltaBigStart(X, gamma, eps=0.001):
    return Adadelta(X, gamma, lr=50.0, eps=eps)

def Adam(X, beta1, beta2=0.999, lr=0.25, eps=0.0000001):
    Y = []
    m = 0
    v = 0
    for i, x in enumerate(X):
        m = beta1*m + (1-beta1)*x
        v = beta2*v + (1-beta2)*x*x
        m_hat = m/(1- pow(beta1, i+1) )
        v_hat = v/(1- pow(beta2, i+1) )
        dthetha = lr/np.sqrt(v_hat + eps)*m_hat
        Y.append(dthetha)
    return np.asarray(Y)

np.random.seed(413)
X = np.arange(0, 300)

D_Thetha_spikes = np.asarray( [int(x%60 == 0) for x in X])
D_Thetha_rectangles = np.asarray( [2*int(x%40 < 20) - 1 for x in X])
D_Thetha_noisy_sin = np.asarray( [np.sin(x/20) + np.random.random() - 0.5 for x in X])
D_Thetha_very_noisy_sin = np.asarray( [np.sin(x/20)/5 + np.random.random() - 0.5 for x in X])
D_Thetha_uneven_sawtooth = np.asarray( [ x%20/(15*int(x > 80) + 5) for x in X])
D_Thetha_saturation = np.asarray( [ int(x % 80 < 40) for x in X])

for method_label, method, parameter_step in [
                ("GRAD_Simple_Momentum", EDM, [0.25, 0.9, 0.975]),
                ("GRAD_Nesterov", NM, [0.25, 0.9, 0.975]),
                ("GRAD_Smoothed_Nesterov", SmoothedNM, [0.25, 0.9, 0.975]),
                ("GRAD_Adagrad", Adagrad, [0.0000001, 0.1, 10.0]),
                ("GRAD_RMSProp", RMSProp, [0.25, 0.9, 0.975]),
                ("GRAD_AdadeltaZeroStart", AdadeltaZeroStart, [0.25, 0.9, 0.975]),
                ("GRAD_AdadeltaBigStart", AdadeltaBigStart, [0.25, 0.9, 0.975]),
                ("GRAD_Adam", Adam, [0.25, 0.9, 0.975]),
            ]:
    for label, D_Thetha in [("spikes", D_Thetha_spikes),
                            ("rectangles", D_Thetha_rectangles),
                            ("noisy sin", D_Thetha_noisy_sin),
                            ("very noisy sin", D_Thetha_very_noisy_sin),
                            ("uneven sawtooth", D_Thetha_uneven_sawtooth),
                            ("saturation", D_Thetha_saturation), ]:
        fig = plt.figure(figsize=[16.0, 9.0])
        ax = fig.add_subplot(111)

        ax.plot(X, D_Thetha, label="gradient")
        for gamma in parameter_step:
            Y = method(D_Thetha, gamma)
            ax.plot(X, Y, label="param="+str(gamma))

        ax.spines['bottom'].set_position('zero')
        full_name = method_label + "_" + label

        plt.xticks(np.arange(0, 300, 20))
        plt.grid(True)
        plt.title(full_name)
        plt.xlabel('epoch')
        plt.ylabel('value')
        plt.legend()
        # plt.show(block=True) #Uncoomment and comment next line if you just want to watch
        plt.savefig(full_name)
        plt.close(fig)
If you want to experiment with the parameters of the algorithms and your own functions, use this to create your own animation of the trajectory of the minimizer (you also need theano / lasagne):
More code
import numpy as np
import matplotlib
matplotlib.use("Agg")
import matplotlib.pyplot as plt
import matplotlib.animation as animation
import theano
import theano.tensor as T
from lasagne.updates import nesterov_momentum, rmsprop, adadelta, adagrad, adam

#For reproducibility. Comment it out for randomness
np.random.seed(413)

#Uncoomment and comment next line if you want to try random init
# clean_random_weights = scipy.random.standard_normal((2, 1))
clean_random_weights = np.asarray([[-2.8], [-2.5]])
W = theano.shared(clean_random_weights)
Wprobe = T.matrix('weights')

levels = [x/4.0 for x in range(-8, 2*12, 1)] + [6.25, 6.5, 6.75, 7] + \
         list(range(8, 20, 1))
levels = np.asarray(levels)

O_simple_quad = (W**2).sum()
O_wobbly = (W**2).sum()/3 + T.abs_(W[0][0])*T.sqrt(T.abs_(W[0][0]) + 0.1) + 3*T.sin(W.sum()) + 3.0 + 8*T.exp(-2*((W[0][0] + 1)**2+(W[1][0] + 2)**2))
O_basins_and_walls = (W**2).sum()/2 + T.sin(W[0][0]*4)**2
O_ripple = (W**2).sum()/3 + (T.sin(W[0][0]*20)**2 + T.sin(W[1][0]*20)**2)/15
O_giant_plateu = 4*(1-T.exp(-((W[0][0])**2+(W[1][0])**2)))
O_hills_and_canyon = (W**2).sum()/3 + \
                     3*T.exp(-((W[0][0] + 1)**2+(W[1][0] + 2)**2)) + \
                       T.exp(-1.5*(2*(W[0][0] + 2)**2+(W[1][0] -0.5)**2)) + \
                     3*T.exp(-1.5*((W[0][0] -1)**2+2*(W[1][0] + 1.5)**2)) + \
                     1.5*T.exp(-((W[0][0] + 1.5)**2+3*(W[1][0] + 0.5)**2)) + \
                     4*(1 - T.exp(-((W[0][0] + W[1][0])**2)))

O_two_minimums = 4-0.5*T.exp(-((W[0][0] + 2.5)**2+(W[1][0] + 2.5)**2))-3*T.exp(-((W[0][0])**2+(W[1][0])**2))

nesterov_testsuit = [
                (nesterov_momentum, "nesterov momentum 0.25",    {"learning_rate": 0.01, "momentum": 0.25}),
                (nesterov_momentum, "nesterov momentum 0.9",     {"learning_rate": 0.01, "momentum": 0.9}),
                (nesterov_momentum, "nesterov momentum 0.975",   {"learning_rate": 0.01, "momentum": 0.975})
            ]

cross_method_testsuit = [
                (nesterov_momentum, "nesterov",     {"learning_rate": 0.01}),
                (rmsprop,           "rmsprop",      {"learning_rate": 0.25}),
                (adadelta,          "adadelta",     {"learning_rate": 100.0}),
                (adagrad,           "adagrad",      {"learning_rate": 1.0}),
                (adam,              "adam",         {"learning_rate": 0.25})
            ]

for O, plot_label in [
           (O_wobbly, "Wobbly"),
           (O_basins_and_walls, "Basins_and_walls"),
           (O_giant_plateu, "Giant_plateu"),
           (O_hills_and_canyon, "Hills_and_canyon"),
           (O_two_minimums, "Bad_init")
        ]:

    result_probe = theano.function([Wprobe], O, givens=[(W, Wprobe)])

    history = {}
    for method, history_mark, kwargs_to_method in cross_method_testsuit:
        W.set_value(clean_random_weights)
        history[history_mark] = [W.eval().flatten()]

        updates = method(O, [W], **kwargs_to_method)
        train_fnc = theano.function(inputs=[], outputs=O, updates=updates)

        for i in range(125):
            result_val = train_fnc()
            print("Iteration " + str(i) + " result: "+ str(result_val))
            history[history_mark].append(W.eval().flatten())

        print("-------- DONE {}-------".format(history_mark))

    delta = 0.05
    mesh = np.arange(-3.0, 3.0, delta)
    X, Y = np.meshgrid(mesh, mesh)

    Z = []
    for y in mesh:
        z = []
        for x in mesh:
            z.append(result_probe([[x], [y]]))
        Z.append(z)
    Z = np.asarray(Z)

    print("-------- BUILT MESH -------")

    fig, ax = plt.subplots(figsize=[12.0, 8.0])
    CS = ax.contour(X, Y, Z, levels=levels)
    plt.clabel(CS, inline=1, fontsize=10)
    plt.title(plot_label)

    nphistory = []
    for key in history:
        nphistory.append(
                [np.asarray([h[0] for h in history[key]]),
                 np.asarray([h[1] for h in history[key]]),
                 key]
            )

    lines = []
    for nph in nphistory:
        lines += ax.plot(nph[0], nph[1], label=nph[2])
    leg = plt.legend()

    plt.savefig(plot_label + '_final.png')

    def animate(i):
        for line, hist in zip(lines, nphistory):
            line.set_xdata(hist[0][:i])
            line.set_ydata(hist[1][:i])
        return lines

    def init():
        for line, hist in zip(lines, nphistory):
            line.set_ydata(np.ma.array(hist[0], mask=True))
        return lines

    ani = animation.FuncAnimation(fig, animate, np.arange(1, 120), init_func=init,
                                  interval=100, repeat_delay=0, blit=True, repeat=True)

    print("-------- WRITING ANIMATION -------")

    # plt.show(block=True) #Uncoomment and comment next line if you just want to watch
    ani.save(plot_label + '.mp4', writer='ffmpeg_file', fps=5)

    print("-------- DONE {} -------".format(plot_label))
Comments
To leave a comment
Computational Intelligence
Terms: Computational Intelligence