
Lecture
The HTML5 Canvas tag is an exceptionally useful tool for drawing and animation. The Canvas tag uses JavaScript technology to draw graphical objects directly on a web page. Canvas is a rectangular area defined and controlled by the developer. This area allows for scriptable rendering of two-dimensional 2D shapes and raster images.
The Canvas tag is ideal for creating impressive visual material that enhances user interfaces, diagrams, photo albums, charts, graphs, animated material and embeddable graphical applications. The Canvas tag has several methods for drawing paths, rectangles, circles and characters.
A prerequisite for creating images in a Canvas environment is familiarity with the coordinate grid (coordinate plane). The spatial area's dimensions in width and height are set in pixels. The Canvas environment uses x and y coordinates. The top-left corner of the Canvas area has the coordinates x=0, y=0.
By default, the rectangular Canvas area has a width of 300 pixels and a height of 150 pixels, but you can set the exact dimensions of the Canvas tag by specifying its width and height. The diagram in figure 1 demonstrates the organization of the coordinate space along x and y.
Figure 1. Canvas coordinates
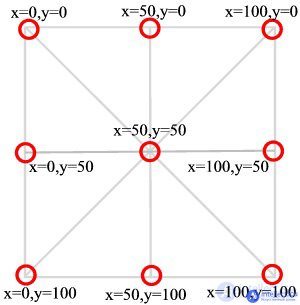
Figure 1 shows a Canvas area measuring 100 x 100 pixels.
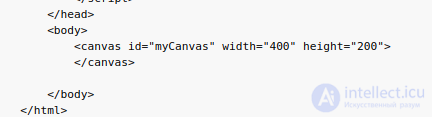
To place anything into the Canvas area, you first need to define the Canvas area in the HTML file. To draw your images, you must create JavaScript code that accesses the tag and communicates with the HTML5 Canvas API.
The basic structure of the Canvas tag looks like this:
The canvas tag has two attributes of its own: width (height) and height (width). In addition, the Canvas tag has all the key HTML5 attributes, such as class, id and name. The id attribute is used in the code shown above. The JavaScript code uses the id identifier created here for the Canvas tag to designate the Canvas area on which drawing will be performed. The JavaScript code finds the proper Canvas area using the document.getElementById() method, as shown below.
var canvas = document.getElementById("myCanvas");
Every Canvas tag must have a context definition, as shown below. Currently, the official specification only covers the 2D environment.
var context = canvas.getContext("2d");
After identifying the proper Canvas area and specifying its context, you can start drawing.
Back to top
The coverage of HTML5 Canvas topics in this article spans various drawing tools, effects and transformations. The drawing tools provide for the creation of the following objects:
We will use the following Canvas effects:
The following transformations will be covered:
To draw a line in the Canvas environment, use the moveTo(), lineTo() and stroke() methods. In addition, use the beginPath() method to reset the current path.
The beginPath() method starts a new path. Before drawing a new line with different subpaths, you need to apply the beginPath() method to specify a new starting point for drawing. When you draw the first line, there is no need to call the beginPath() method.
The moveTo() method sets the starting point at which a new subpath should begin. The lineTo() method creates subpaths. The appearance of a line can be changed using the lineWidth and strokeStyle tags. The lineWidth tag changes the thickness of the line, and the strokeStyle tag changes the color of the line.
Figure 2 shows three lines drawn using different colors.
Figure 2. Canvas area with lines of different colors
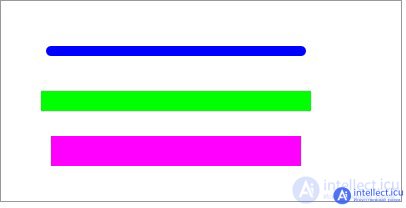
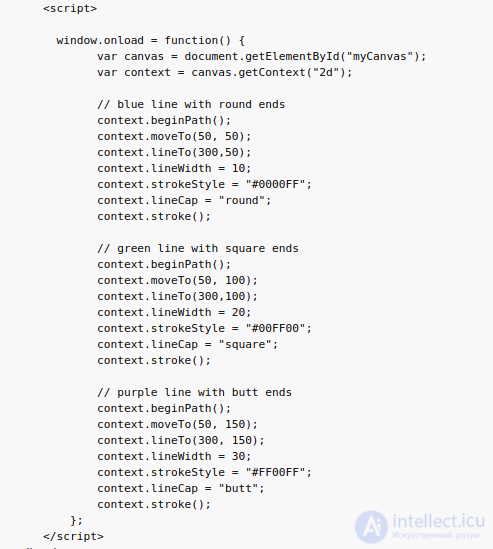
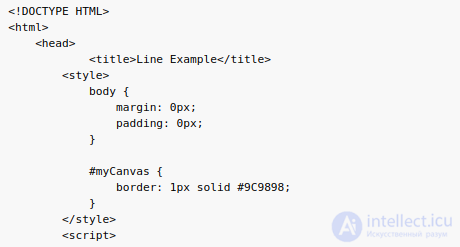
The lines in figure 2 were created using the code shown in listing 1. The blue line with rounded ends is created as follows. First, the need to start a new path is indicated: context.beginPath(). Then the following methods are used:
All the lines described are 50 pixels long, although they appear to be of different lengths — this is a visual illusion produced by so-called «line caps» (line cap). There are three possible types of caps:
By default, the butt cap is used. When using rounded or square caps, the length of the line increases by an amount equal to the width of that line. For example, a line 200 pixels long and 10 pixels wide with rounded or square caps will have a resulting length of 210 pixels, since each cap adds 5 pixels to each end of the line. A line 200 pixels long and 20 pixels wide with rounded or square caps will have a resulting length of 220 pixels, since each cap adds 10 pixels to each end of the line.
To better understand how line drawing works, run and modify the code in figure 1.
Listing 1. Creating three lines of different colors in the Canvas environment
There are three methods for creating a rectangular area in Canvas:
For each of these three methods, x and y set the position on the Canvas relative to the top-left corner of the rectangle (x=0, y=0), while width and height set the width and height of the rectangle, respectively.
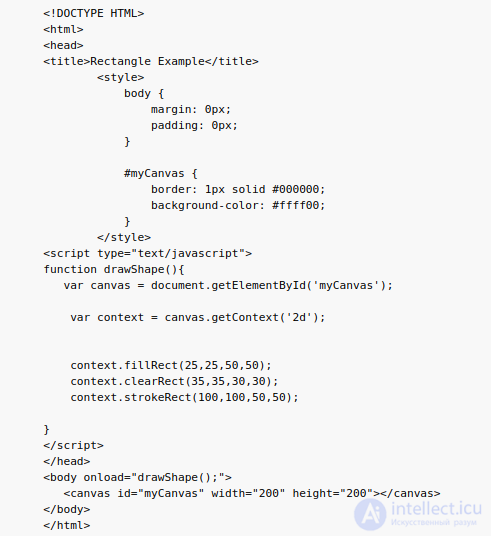
Figure 3 shows three rectangular areas created using the code in listing 2.
Figure 3. Canvas rectangular area
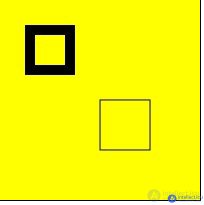
The fillRect() method creates a rectangle filled with the default color (black). The clearRect() method creates a rectangular area in the center of the first rectangle. It is placed in the center of the rectangle formed by the fillRect() method. The strokeRect method creates a rectangle that has only a visible black border.
Listing 2. Code for drawing rectangular areas on Canvas
Rectangle Example
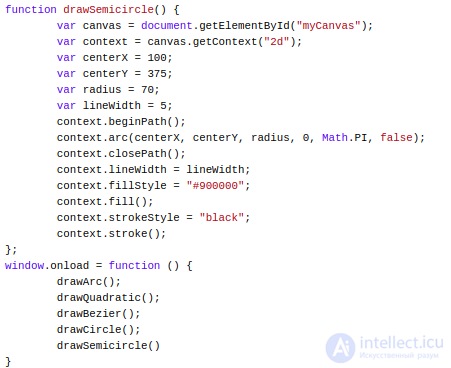
The arc() method is used to draw circles and semicircles. The arc() method takes six arguments:
context.arc(centerX, centerY, radius, startingAngle, endingAngle, antiClockwise);
The centerX and centerY arguments specify the coordinates of the circle's center. The radius argument is the radius, i.e. the straight-line distance from the center to the circumference. The arc created will be part of the specified circle. The startAngle and endAngle arguments are the starting and ending points of the arc, respectively (in radians). The anticlockwise argument is of type Boolean. If this argument is true, the arc is drawn counterclockwise; if it is false, the arc is drawn clockwise.
To draw a full circle with the arc() method, set the starting angle to 0 and the ending angle to 2*PI, as shown below.
context.arc(centerX, centerY, radius, 0, 2 * Math.PI, false);
To draw a semicircle with the arc() method, set the starting angle to startingAngle + PI, as shown below.
context.arc(centerX, centerY, radius, startingAngle, startingAngle + Math.PI, false);
A quadratic curve is created using the quadraticCurveTo() method, as shown below. A quadratic curve is defined by the context point, a control point and an end point. The control point sets the curvature of the curve.
context.moveTo(x, y);
context.quadraticCurveTo(controlX, controlY, endX, endY);
A Bezier curve has a starting point and an end point, just like a quadratic curve, but unlike it has two control points.
context.moveTo(x, y);
context.bezierCurveTo(controlX1, controlY1, controlX2, controlY2, endX, endY);
A Bezier curve is created using the bezierCurveTo() method. Since a Bezier curve is defined by two control points instead of one, it allows more complex curves to be created.
Figure 4 shows (from left to right): an arc, a quadratic curve, a Bezier curve, a semicircle and a circle.
Figure 4. Arc, curves and circle
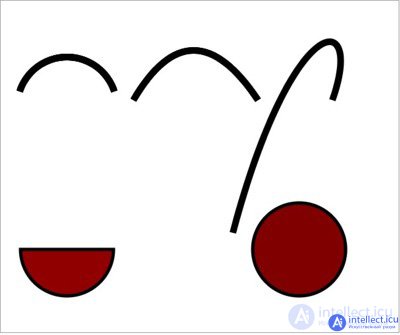
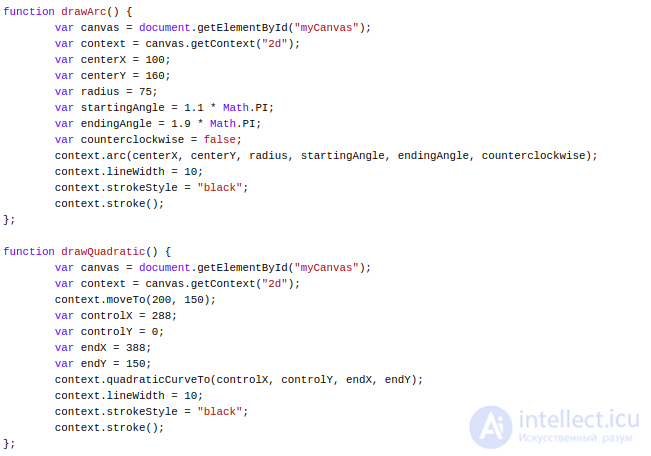
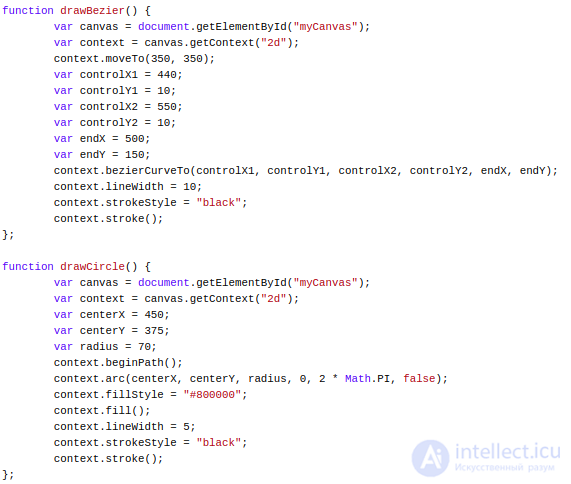
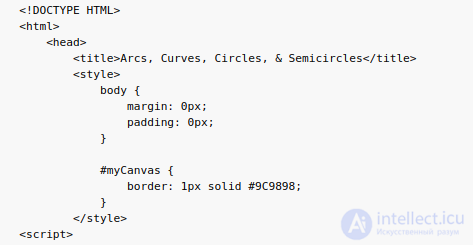
The image in figure 4 was created using the code shown in listing 3.
Listing 3. Code for the arc, curve and circle
Arcs, Curves, Circles, & Semicircles
The translate(), scale() and rotate() methods change the current state of the image. This is described on the website https://intellect.icu. The translate(x, y) method moves objects on the Canvas to another point of the coordinate grid. In the translate(x,y) method, the coordinates (x,y) denote, respectively, the number of pixels by which to move the image along the x direction, and the number of pixels by which to move the image along the y direction.
If you draw an image at point (15,25) using the drawImage() method, you can use the translate() method with the arguments (20,30), which places that image at the point (15+20, 25+30) = (35, 55).
The scale(x,y) method changes the dimensions of the image. The x argument sets the horizontal scaling factor, and the y argument sets the vertical scaling factor. For example, the scale(1.5, .75) method will produce an image that is 50% larger than the original along the x coordinate, while along the y coordinate it will be only 75% of the size of the original image. The rotate(angle) method rotates the object by the specified angle.
Figure 5 shows the result of applying the translate(), scale() and rotate() methods.
Figure 5. Using transformations
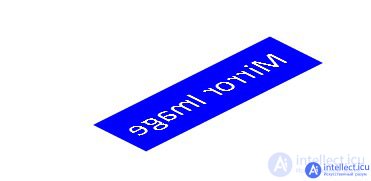
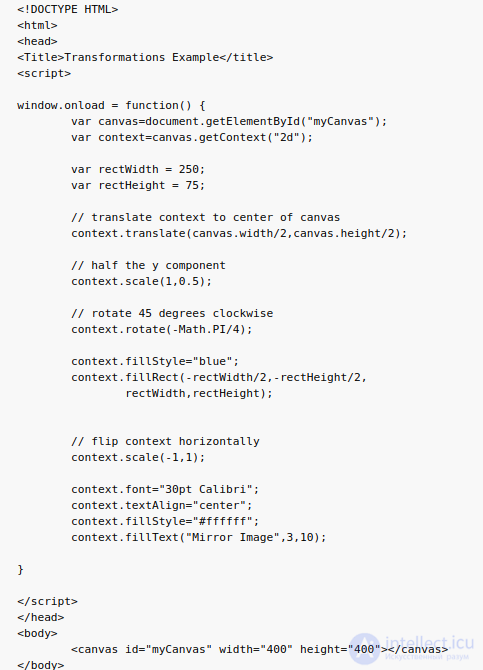
Listing 4 shows the code used to create the image in figure 5.
Listing 4. Code for creating transformations
Transformations Example
Gradients
A gradient — is a fill that transitions from one color to another, blending the colors in the zones where they overlap. Canvas supports two types of gradients: linear and radial.
A linear gradient is implemented using the createLinearGradient() method. The createLinearGradient(x0,y0,x1,y1) method creates a gradient along a straight line defined by two points: (x0,y0) and (x1,y1), which are the starting and ending points of the gradient, respectively. This method returns an object.
A color gradient can span multiple colors. The addcolorStop(offset, color) method sets a color-stop, up to which the specified color should change gradually at the given offset. The addColorStop() method lets you set an offset from 0 to 1, at which the transition to the next color begins. A value of 0 — is the offset at one end of the gradient; a value of 1 — is the offset at the other end of the gradient. Once the color gradient has been set, the gradient object can be assigned to the fillStyle() method. The fillText() method lets you draw text with a gradient color change.
A radial gradient —createradialGradient(x0,y0,r0,x1,y1,r1)— combines two or more colors in a circular or conical pattern using six arguments:
Figure 6 shows four gradients: a linear gradient, a text gradient, a linear diagonal gradient and a radial gradient.
Figure 6. Gradient examples
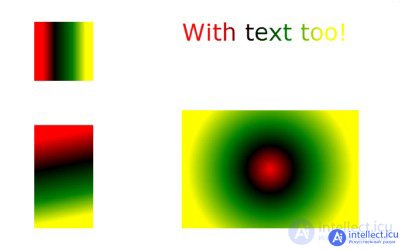
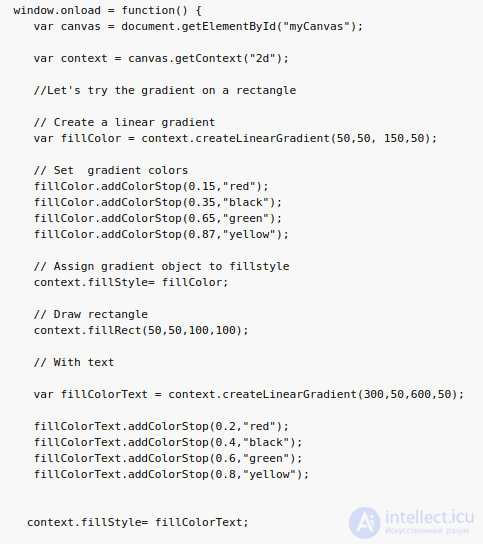
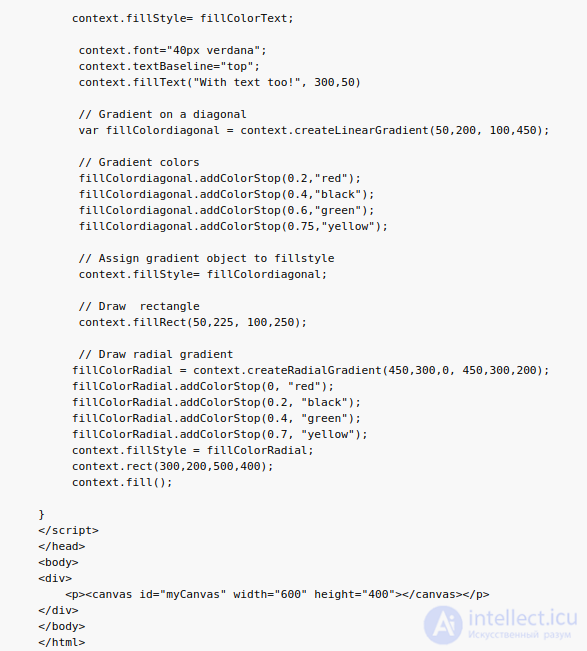
The image in figure 6 was created using the code shown in listing 5.
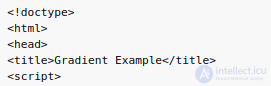
Listing 5. Example code for building a gradient
Gradient Example
You can modify images by cropping specific areas of them. Cropping in the Canvas environment is provided by overloading the drawImage() method. The drawImage() method has three options. You can use configurations with three, five or nine arguments.
The three-argument configuration —drawImage(image, dx, dy)— renders an image on the Canvas with the target coordinates (dx, dy). These coordinates set the top-left corner of the resulting image.
The five-argument configuration —drawImage(image, dx, dy, dw, dh)— sets the width and height of the target image. The source image is scaled so that the resulting image has the specified width and height.
The nine-argument configuration —drawImage(image, sx, sy, sw, sh, dx, dy, dw, dh)— crops the source image to a rectangular area starting at the point with coordinates (sx,sy), which has width and height (sw,sh), and then scales it so that the resulting image has width and height (dw,dh), placing it on the Canvas at point (dx,dy).
Figure 7 shows the image that we will crop.
Figure 7. Cropping an image
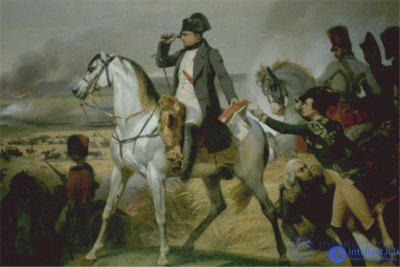
Let's use the image in figure 7 and place several images on the Canvas. One of these images matches the Canvas in size and is used as the background. The second image, at a reduced size, is overlaid in the bottom-right part of the Canvas. The third image, a cropped head of Napoleon, is overlaid in the top-left corner of the Canvas. The resulting cropped image is shown in figure 8.
Figure 8. The final cropped image
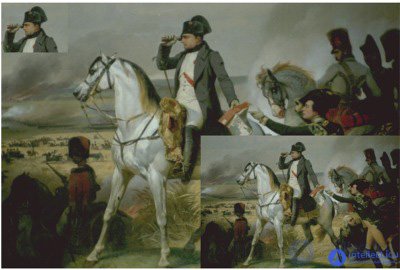
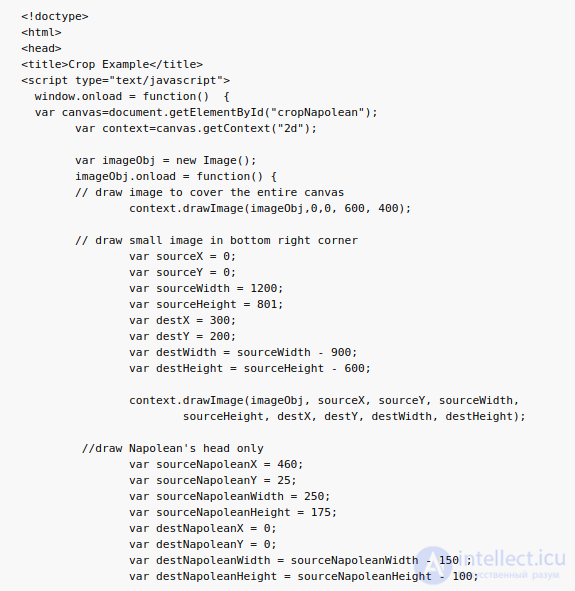
The image in figure 8 was created using the code shown in listing 6. Before running this code, remember to load the Napolean.png image that was used in this example.
Listing 6. Code for cropping the example image
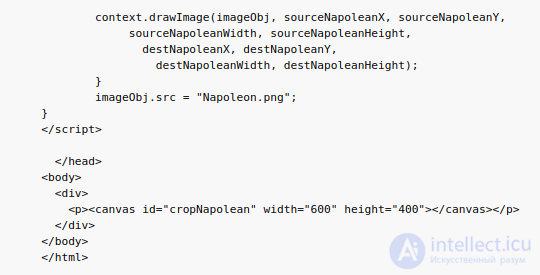
Crop Example
When creating animations, there is always a need to work with layers. Layers let you isolate components, which considerably simplifies coding and debugging, and also improves the efficiency of these operations. The Canvas API does not have layers, but we can create several Canvas environments.
An animation must be driven by time. Thus, to create an animation, you need access to each of its frames. With respect to animation, the Canvas API has one significant limitation: once an image is drawn in a Canvas environment, it stays there unchanged. To move the image, it must be redrawn.
To create an animation, follow these steps.
Animation can be controlled in two ways: using the setInterval function or the setTimeout function, either of which can be used to call some function after a given period of time has elapsed. The setInterval function executes the given code repeatedly. The setTimeout function executes only once after the allotted period of time has elapsed.
Figure 9 shows one frame of a swimmer animation using several Canvas environments. The water is on one Canvas environment, and the swimmer is on another Canvas environment.
Figure 9. Animation using images on several Canvas tags
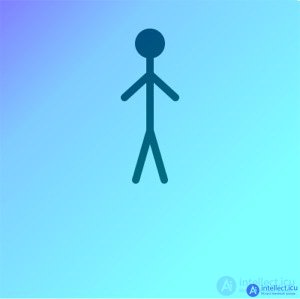
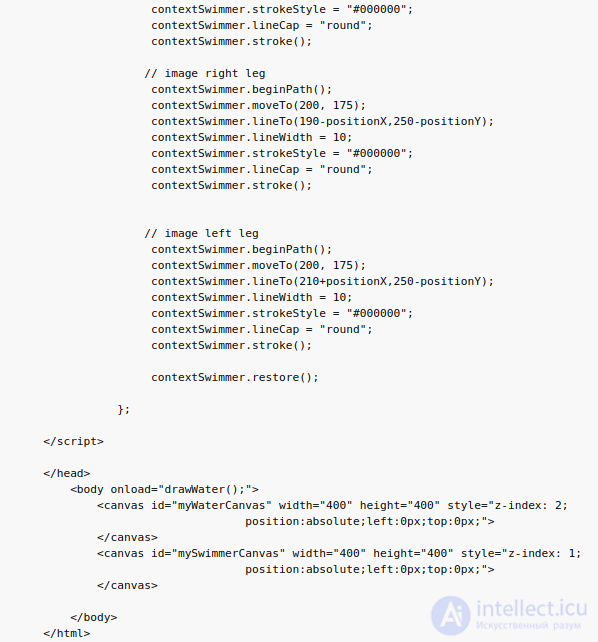
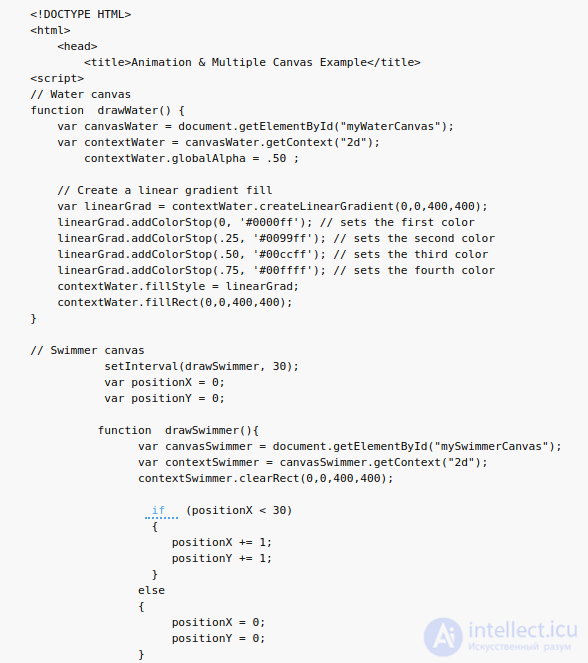
The swimmer is created using the code shown in listing 7. A linear gradient is used to create the water. The water has four shades of blue, which gives a reasonably convincing illusion of water. The swimmer's motion is created by using the positionX and positionY values, which change the pose of the image. The swimmer's head is created using the arc() method. The swimmer's legs and arms are created by drawing lines and then changing their positions using lineTo(). Changes to the torso are made by changing position using moveTo(). Since we are dealing with an animation, you need to run this code to see the swimmer's motion.
Listing 7. Animation example
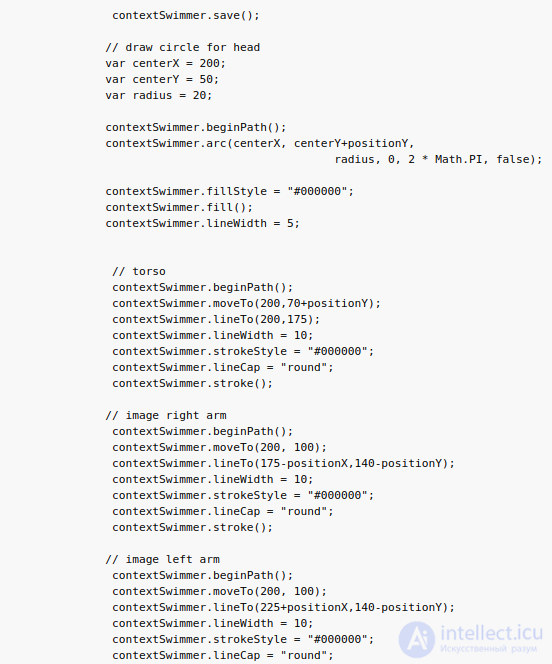
Animation & Multiple Canvas Example
The HTML5 Canvas tag plays a central role in creating browser-based RIA applications. It provides a practical drawing environment based on JavaScript technology, limited only by the developer's imagination. This environment is not too difficult to master. In addition, the Internet has a huge number of support tools that make learning and preparation easier, including quick guides, blogs, online articles, video and text tutorials, and sample applications.
The ability to change text and images visually and to simulate motion makes Canvas an extremely valuable tool. Regardless of whether you use Canvas as a designer or a developer, whether you use Canvas to build gaming applications for mobile devices, or simply want to make better use of the screen's working surface — in any case, Canvas is one of the most important components of the capabilities provided by the HTML5 specification.
CANVAS step by step:
If you trust an English-Russian dictionary, you'll learn that canvas translates as "holst" (canvas fabric), and if you trust Wikipedia, you'll learn that the canvas tag is an HTML5 element intended for creating a raster image using JavaScript. My short piece will be devoted to how to create that raster image. Before you start trying your hand at this none-too-easy task, it's recommended that you already have basic knowledge of what HTML is and what JavaScript is all about.
Our test subject tag has only two attributes — height and width, respectively, and by default the canvas size is 150x300 pixels.
It's worth noting that canvas creates an area of fixed size, the content of which is managed by contexts.
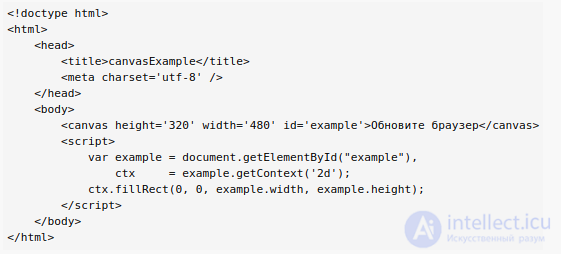
A basic example:
canvasExampleRefresh the browser
If you save these poor 13 lines to a file and open it in a browser, you'll see an area with a black rectangle — that's the very canvas on which a rectangle has been drawn whose dimensions equal the dimensions of the canvas.
The simplest shape you can draw is a rectangle. Three functions are provided for drawing rectangles.
strokeRect(x, y, width, height) // Draws a rectangle
fillRect(x, y, width, height)   // Draws a filled rectangle
clearRect(x, y, width, height)  // Clears an area of the canvas the size of a rectangle of the given dimensions
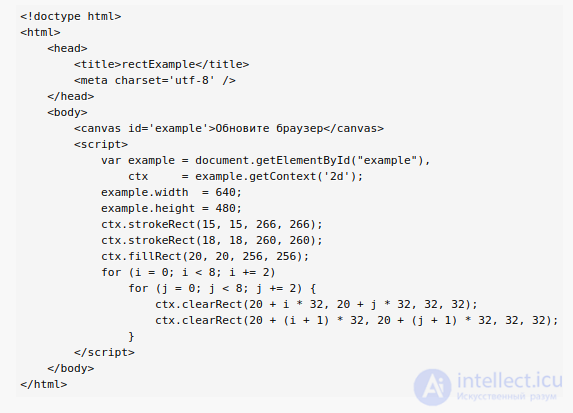
An example illustrating how these functions work:
Now a brief line-by-line breakdown:
in lines 10 and 11 we changed the size of the canvas — so that the image we had in mind would be fully displayed,
in lines 12 and 13 we drew two unfilled rectangles that will serve as a sort of frame for our «chessboard»,
in line 14 we render a filled rectangle sized so as to fit 64 squares with a side width of 32 pixels,
in lines 15 through 19 we have two loops running that clear square areas on the black rectangle in such an order that the resulting image ends up looking like a chessboard
Drawing shapes made up of lines is done sequentially in several steps:
beginPath()
closePath()
stroke()
fill()
beginPath is used to «begin» a series of actions describing the drawing of a shape. Each new call to this method resets all the actions of the previous one and starts «drawing» anew.
closePath is an optional action, and in essence it attempts to finish the drawing by drawing a line from the current position to the position from which drawing started.
The final step is a call to the stroke or fill method. The former outlines the shape with lines, while the latter fills the shape with a solid color.
Anyone who once, back in the day on school 486es, drew a house, a fence and a little tree in BASIC to the teacher's assignment will immediately understand the part below. So, there are methods such as,
moveTo(x, y) // moves the "cursor" to position x, y and makes it the current one
lineTo(x, y) // draws a line from the current position to the specified one, and afterwards makes the specified one current
arc(x, y, radius, startAngle, endAngle, anticlockwise) // draws an arc, where x and y are the center of the circle, followed by the starting and ending angle, and the last parameter indicates the direction
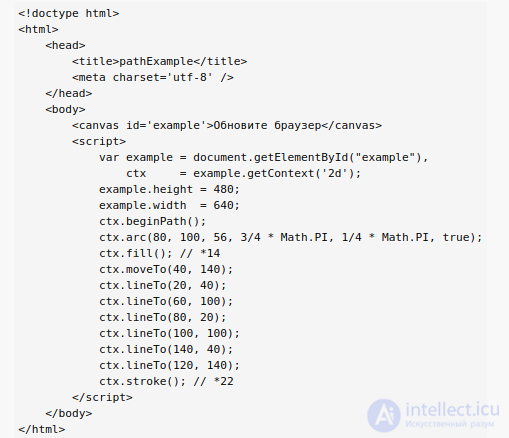
The example below shows the action of everything described above:
In line 14 the arc is filled with color, in line 22 the outline of our crown is traced.
I think Wikipedia will explain what Bezier curves are better than I can.
We have two functions available for constructing cubic and quadratic Bezier curves, respectively:
quadraticCurveTo(Px, Py, x, y)
bezierCurveTo(P1x, P1y, P2x, P2y, x, y)
x and y are the points we need to move to, while the coordinates P(Px, Py) in the quadratic curve are additional points used to build the curve. In the cubic curve, accordingly, there are two additional points.
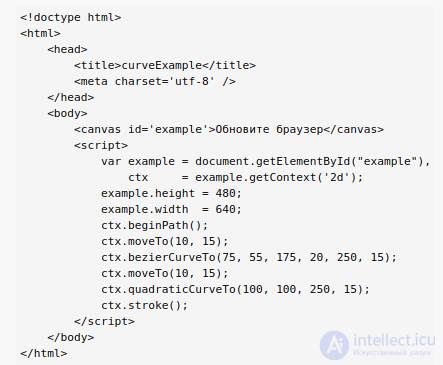
Example of two curves:
So that our image isn't limited to just two colors, but can be any color, two properties are provided
fillStyle = color   // defines the fill color
strokeStyle = color // the color of lines; the color is set exactly the same way as in css; the example shows all four ways of specifying a color
The color is set exactly the same way as in css; the example shows all four ways of specifying a color
// all four lines set the fill color to orange
ctx.fillStyle = "orange";
ctx.fillStyle = "#FFA500";
ctx.fillStyle = "rgb(255,165,0)";
ctx.fillStyle = "rgba(255,165,0,1)"
The color for lines is set the same way.
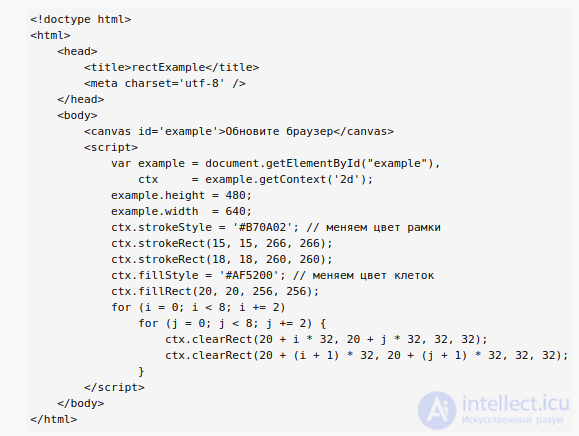
Let's take the checkerboard example and add a bit of color to it:
To absorb the material and reinforce what I've read in practice, I always set myself a modest goal that would both cover everything I've read and, at the same time, be an interesting process for me personally. In this case I'll try to draw a level from one of my favorite childhood games. Naturally, for lack of time — I won't add lives to it, and instead I'll make the code as clear as possible, covering practically everything described here today.
I recreated one of the levels of the game BattleCity, known here as Tanchiki, and here's a link on pastebin in case Dropbox doesn't respond.
One last comment about the example. In the specifications for the images that the Dandy can output, the screen resolution must be 256×240 pixels.
The battlefield in the well-known Tanchiki is 13x13 large blocks in size. Each of them is drawn from 4 repeating sprites (which, by total count, comes out to 26x26=676 on the map). So let's work out how it was in the original, in pixels, and how to scale it correctly. If you divide 240 by 26, the integer part of the division turns out to be 8. It follows that the texture size was 8x8 pixels, i.e. the battlefield size is 208x208, and a large block is 16x16. The width must be 256 pixels. Now let's calculate the size of the right-hand column with extra information and the size of the top/bottom margins. On the right, if you look closely, the width equals two blocks, i.e. 2*16=32. We already have 32+208=240; on the left there's a 16-pixel field, and the top and bottom likewise each have 16 pixels. In my example, the size of the large block is stored in the variable cellSize, and all the calculations are derived from its value. You can experiment and change its value; I strongly recommend making it a power of two (16, 32, 64, 128...); if you want everything to look the way it did on a good old Dandy, set its value to 16. Although it looks fine with any other value too. If the way I write appeals to someone other than me, I'll write a sequel — but what will be in it, I'll keep to myself for now
CANVAS step by step:
Continuation of the article on drawing on canvas, in which we'll learn to use images. Naturally, drawing on canvas with primitives is quite inconvenient and requires a fair amount of effort, and the result sometimes clearly falls short in quality. That's why the canvas API naturally provides for working with images. Adding an image can conditionally be split into two steps: creating a JavaScript Image object, and the second, final step — drawing the image onto the canvas using the drawImage function. Let's look at both steps in more detail.
Creating a new graphical object:
var img = new Image();  // Creating a new image object
img.src = 'image.png';  // Path to the image to be drawn onto the canvas
By the way, as the image source you can also specify a string like this, in which the image itself is described:
img.src = 'data:image/gif;base64,R0lG.... s=';
Now let's move on to drawing the image onto the canvas. For this there's the drawImage function.
drawImage(image, x, y) // Where x and y are the coordinates of the top-left corner of the image, and the first parameter is the image itself
It's worth noting that loading of the image begins right after the image source is assigned to the object, and if it hasn't fully loaded by the time the drawing function is called, it simply won't be drawn on the canvas. To avoid this situation, the following construction is used:
var img = new Image();      // New object
  img.onload = function() { // Event that will fire the moment the image has loaded
    /*
      Some actions
    */
}
img.src = 'myImage.png';    // Path to the image
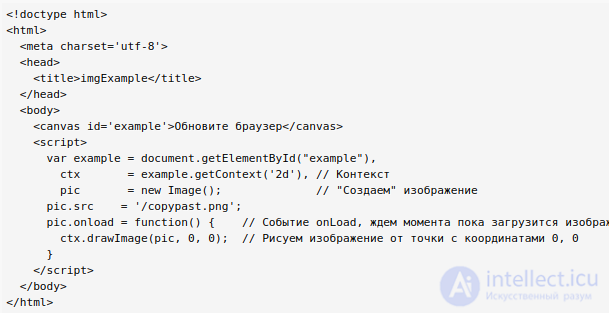
Now we've probably reached the point where we can look at a basic example:
Link to a fiddle with examples for this article.
But if everything were limited to simply drawing an image, there'd be no point writing a separate article — it would be enough to have a subsection «Images» in the previous post. So now we'll try to scale the image, and for that there's yet another way to call the drawImage function:
drawImage(image, x, y, width, height) // the width, height parameters change the width and height of the image
Let's take the previous example and make some changes to drawImage:
ctx.drawImage(pic, 0, 0, 300, 150);
Link to a fiddle with examples for this article.
The third way of calling drawImage, with eight parameters, looks roughly like this:
drawImage(image, sx, sy, sWidth, sHeight, dx, dy, dWidth, dHeight);
// The first parameter points to the image
// sx, sy, sWidth, sHeight specify the parameters of the fragment on the source image
// dx, dy, dWidth, dHeight are responsible for the coordinates at which the fragment is drawn on the canvas
Let's take the same example again and adjust the drawImage function a third time:
ctx.drawImage(pic, 25, 42, 85, 55, 0, 0, 170, 110);
Link to a fiddle with examples for this article.
Now it remains to reinforce everything we've covered with a practical example. As in that earlier example, this will be a small map, only not from some existing game, but one we've invented ourselves. For it to work properly we'll need to create, in any graphics editor, an image assembled from the fragments we'll need to draw a path, a house and a meadow. Generally, map fragments are called tiles, and the file in which they're all collected into a single image is called a tileset. Here's the image I drew myself in the Pinta program on Ubuntu.
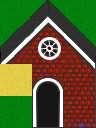
So, the dimensions will be 8 by 8 square blocks, 32 pixels wide. On the map we'll need to depict a house and a path. The elements of the house are drawn by hand, brick by brick, so to speak. The grass and sand were done by filling the area with the corresponding color and adding noise. Of course it's all very primitive, but illustrative.
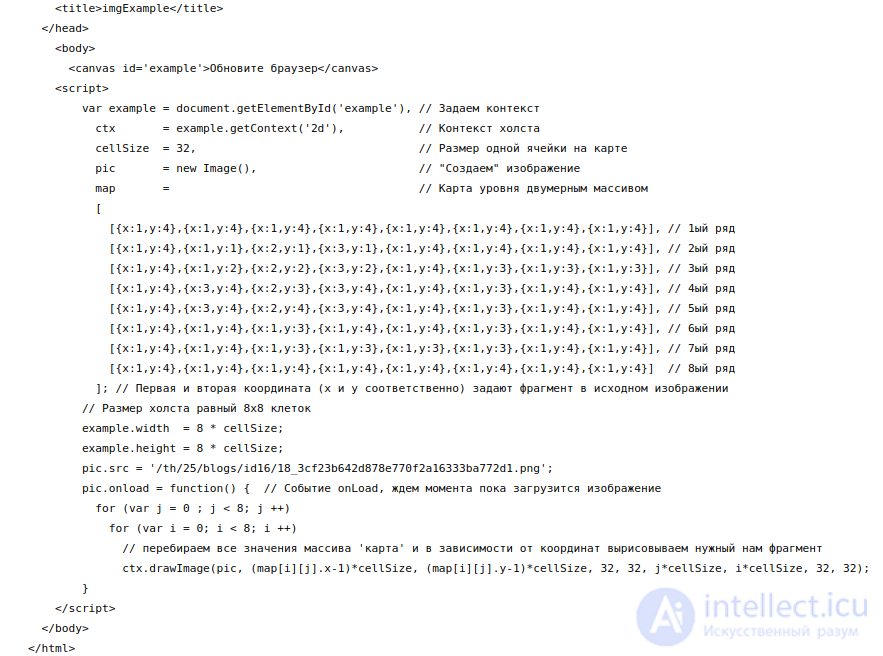
Let's take a close look at a piece of code such as var map = [[{x:1, y: 4}… the values of x and y indicate which element to take from the picture. That is, it becomes clearer if you split the original picture into a 32×32 grid.
And for example:


Comments