
Lecture 20 min.
A connectome (/kəˈnɛktoʊm/) is a comprehensive description of the structure of connections in an organism's nervous system. The field of research that includes the mapping and analysis of the architecture of neuronal connections is called "connectomics".
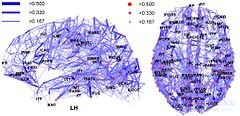
The first connectome to be described, in 1986, was that of the nematode worm Caenorhabditis elegans, whose nervous system has only 302 neurons. A team of scientists mapped all 7,000 connections between the neurons. The human brain, according to the latest data, contains about 86 billion nerve cells and 10,000 times more connections. Many aspects of human individuality, such as personality and intelligence, are believed to be encoded in the connections between neurons, so describing the human connectome could be a major step toward understanding many mental processes. Determining the connectome of the nematode Caenorhabditis elegans took more than 12 years of painstaking work. To determine the connectome of a brain comparable to ours, more advanced automated technologies are needed that will increase the speed at which connectomes can be found.
The term "connectome" itself was proposed in 2005, independently of each other, by the researchers Olaf Sporns and Patric Hagmann.
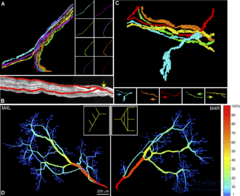
Some researchers use the term connectome for a map of the connections not of the whole organism but of a part of it. Thus, in 2009 a study was published of the connectome of axons innervating the interscutularis muscle of the mouse ear (interscutularis muscle connectome).
In the summer of 2009 the US National Institutes of Health launched the Human Connectome Project, with initial funding of 30 million dollars.
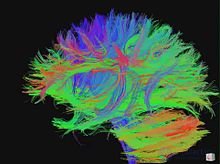
In 2005, Dr. Olaf Sporns of Indiana University and Dr. Patric Hagmann of Lausanne University Hospital independently and simultaneously suggested the term "connectome" to refer to a map of the neural connections in the brain. The name was chosen because of its similarity to the term "genome".
"Connectomics" (Hagmann, 2005) was defined as the science concerned with assembling and analyzing connectome data.
In their 2005 paper "The Human Connectome, a Structural Description of the Human Brain", Sporns and his team wrote:
To understand the functioning of a network, one must know its elements and their interconnections. The purpose of this article is to discuss research strategies aimed at a comprehensive structural description of the network elements and connections forming the human brain. We propose to call this dataset the human "connectome", and we argue that it is fundamentally important in cognitive neuroscience and neuropsychology. The connectome will significantly increase our understanding of how functional brain states emerge from their underlying structural substrate, and will provide new mechanistic insights into how brain function is affected if this structural substrate is disrupted.
In 2005, in his paper "From diffusion MRI to brain connectomics", Dr. Hagmann wrote:
It is clear that, just as the genome is more than the sum of the genes, the set of all neuronal connections in the brain is more important than each individual connection.
Pathways through the white matter of the brain can be determined by histological study using degeneration and axonal tracing methods. The axonal tracing method is the primary basis for mapping long white matter pathways of the brain into an extensive matrix of connections between gray matter regions. The first such studies were carried out on the visual cortex of the macaque (Felleman and Van Essen, 1991) and on the thalamocortical pathway in the cat brain (Scannell et al., 1999). Building databases for such collections of anatomical connections makes it possible to update them continuously and to improve their accuracy. A prominent example of such databases is CoCoMac, the online database of macaque cortex connectivity (Kötter, 2004).
Brain connectivity networks can be represented at different scales, corresponding to levels of spatial resolution in brain imaging (Kötter, 2007; Sporns, 2010). These levels can be roughly classified as microscale, mesoscale and macroscale. Ultimately it will be possible to merge the results obtained at different levels into a single hierarchical map of neuronal organization, which could show everything from an individual neuron within a population of neurons up to such large systems as cortical areas. Because different individuals will have differences in their connectomes, any unified map will most likely provide probabilistic information about neuronal connectivity (Sporns et al., 2005).
Mapping the connectome at the microscale (with micrometer resolution) means constructing a complete map of the neural network, neuron by neuron. The cerebral cortex alone contains on the order of 10 billion neurons connected by 10^14 synaptic connections. For comparison, the number of base pairs in the human genome is 3×10^9.
Some of the main problems in constructing a human connectome at the microscale today[when?] include:
To solve the data collection problems, several groups of scientists are building high-throughput serial electron microscopes (Kasthuri et al., 2009; Bock et al., 2011). Finally, statistical graph theory is a new discipline that is developing sophisticated methods of pattern recognition and tools for the logical processing of these brain graphs (Goldenberg et al., 2009).
The "meso" connectome corresponds to a scale of hundreds of micrometers. Instead of trying to map every individual neuron, a connectome at the mesoscale will attempt to capture anatomically and functionally distinct populations of neurons connected into local circuits (for example, cortical columns) consisting of hundreds or thousands of individual neurons. The task of creating a mesoconnectome is still ambitious and can so far be solved only by invasive methods.
A connectome at the macroscale (with millimeter resolution) attempts to capture large brain systems. Connectome databases at the micro- and mesoscale may be significantly more compact than at the cellular level.
Modern non-invasive imaging methods cannot record brain activity at the neuron-by-neuron level. Mapping the connectome at the cellular level in vertebrates currently requires postmortem (after death) microscopic analysis of limited areas of brain tissue. Non-optical methods based on high-throughput DNA sequencing have recently been proposed by Anthony Zador (CSHL). [25]
Traditional approaches to histological circuit mapping are based on imaging and include light microscopy methods for staining cells, injection of labeling agents for tract tracing, or chemical preservation of the brain, staining, and reconstruction of serially sectioned tissue blocks using electron microscopy (EM). Each of these classical approaches has certain drawbacks when it comes to deployment in connectomics. Staining of individual cells, for example with the Golgi stain, to trace cellular processes and connectivity suffers from the limited resolution of light microscopy, as well as from difficulties in obtaining long-range projections. Tract tracing, which is often called the "gold standard" of neuroanatomy for detecting long-range pathways through the brain, generally allows only fairly large populations of cells and individual axonal pathways to be traced. EM reconstruction has been used successfully to compile the C. elegans connectome (White et al., 1986). However, when applied to larger tissue blocks of whole nervous systems, it has traditionally run into difficulties with projections spanning long distances.
Recent advances in mapping neural connectivity at the cellular level give new and significant hope of overcoming the limitations of classical methods and of compiling cellular connectome datasets (Livet et al., 2007; Lichtman et al., 2008). [26] [27] [28] Using Brainbow, a combinatorial color-labeling method based on the stochastic expression of several fluorescent proteins, Jeff W. Lichtman and his colleagues were able to label individual neurons with one of more than 100 different colors. Labeling individual neurons with a distinguishable hue then makes it possible to trace and reconstruct their cellular structure, including long processes within a tissue block.
In March 2011 the journal Nature published a pair of papers on microconnectomes: Bock et al. [10] and Briggman et al. In both papers the authors first characterized the functional properties of a small subset of cells, and then manually traced a subset of the processes emanating from those cells to obtain a partial subgraph. In keeping with the principles of open science, Bock et al. (2011) made their data publicly available. The full-resolution 12-terabyte dataset from Bock et al. is available at NeuroData. [23] In 2012 the citizen science project EyeWire began attempts to crowdsource the mapping of the connectome through an interactive game. [29] Independently, important topologies of functional interactions among several hundred cells will also gradually be declared (Shimono and Beggs, 2014). [30] Scaling ultrastructural circuit mapping up to the whole mouse brain is currently under way (Mikula, 2012). [31] An alternative approach to mapping connectivity was recently proposed by Zador and his colleagues (Zador et al., 2012). [25] Zador's method, called BOINC (barcoding of individual neuronal connections), uses high-throughput DNA sequencing to map neural circuits. Briefly, the approach consists of labeling each neuron with a unique DNA barcode, transferring barcodes between synaptically connected neurons (for example, using suid herpesvirus 1, SuHV1), and joining the barcodes to represent a synaptic pair. This approach could potentially be cheap, fast and extremely high-throughput.
In 2016, under the Intelligence Advanced Research Projects Activity of the US government, the five-year MICrONS project was launched, involving several institutions, to map one cubic millimeter of rodent visual cortex as part of the BRAIN Initiative. [32] [33] Despite the small volume of biological tissue, this project will yield one of the largest microscale connectomics datasets currently in existence.
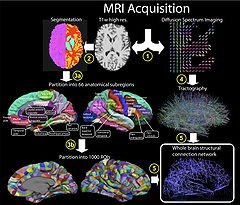
Established methods of brain research, such as axon tracing, opened the first opportunities for creating connectome datasets. However, more recent advances in living subjects have been achieved through the use of non-invasive imaging technologies such as diffusion-weighted magnetic resonance imaging (DW-MRI) and functional magnetic resonance imaging (fMRI). The former, combined with tractography, allows the major fiber bundles in the brain to be reconstructed. The latter allows the researcher to record the brain's network activity (at rest or while performing specific tasks), which makes it possible to identify structurally and anatomically distinct brain regions that are functionally connected.
Notably, the goal of the Human Connectome Project, led by the WU-Minn consortium, is to build a structural and functional map of the healthy human brain at the macroscale, using a combination of several imaging technologies and resolutions.
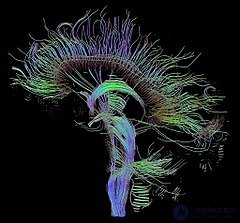
Throughout the 2000s, several researchers attempted to map the large-scale structural architecture of the human cerebral cortex. One attempt used cross-correlation of cortical thickness or volume across different individuals (He et al., 2007). [34] Such gray matter thickness correlations were postulated to be indicators of the presence of structural connections. A drawback of this approach is that it provides only very indirect information about the patterns of cortical connections and requires data from a large number of individuals to obtain a single connectivity dataset for a group of subjects. Other researchers attempted to build whole-brain connectivity matrices from DW-MRI imaging data.
The Blue Brain Project is attempting to reconstruct the entire mouse connectome using a diamond knife sharpened to an atomic edge and electron microscopy to image tissue sections.
The first studies in human macroscale connectomics were made using either equally sized regions or anatomical regions with a vague relationship to the underlying functional organization of the brain (for example, gyral or sulcal regions). Although much can be learned from these approaches, it is highly desirable to divide the brain into functionally distinct parts: brain areas with different architectonics, connectivity, function and/or topography (Felleman and Van Essen, 1991). [14] Accurate parcellation allows each node in the macroscale connectome to be more informative by associating it with a distinct connectivity pattern and functional profile. Subdivision of localized cortical areas has been carried out using diffusion tractography (Beckmann et al. 2009) [35] and functional connectivity (Nelson et al. 2010) [36] to non-invasively measure connectivity patterns and to define cortical areas on the basis of distinct connectivity patterns. Such analysis is best performed at the whole-brain scale and by integrating non-invasive methods. Accurate whole-brain parcellation may lead to more precise macroscale connectomes for the normal brain, which can then be compared with disease states.
At the start of the connectome project it was believed that once a connection between neurons was established it could not be changed, and that only individual synapses could change. [13] However, recent evidence suggests that connectivity is also subject to change, known as neuroplasticity. The brain can rewire in two ways: by forming and removing synapses within an established connection, or by forming or removing entire connections between neurons. [37] Both rewiring mechanisms are useful for learning entirely new tasks, which may require entirely new connections between brain areas. [38] However, the brain's ability to acquire or lose entire connections poses a problem for mapping a universal connectome of a species. Although circuit change occurs at different scales, from microscale to macroscale, each scale does not occur in isolation. For example, in the C. elegans connectome the total number of synapses increases 5-fold from birth to adulthood, altering the properties of both the local and the global network.
Microscale rewiring is the formation or removal of synaptic connections between two neurons, which can be studied using longitudinal two-photon imaging. It can be shown that dendritic spines on pyramidal neurons form within a few days after sensory experience and learning. [39] [40] [41] Changes can be seen even within five hours on the apical tufts of layer 5 pyramidal neurons in the primary motor cortex after a primate has learned a seed-retrieval task. [41]
Rewiring at the mesoscale involves the presence or absence of entire connections between neurons. [38] Evidence for this level of rewiring comes from observations that local circuits form new connections as a result of experience-dependent plasticity in the visual cortex. In addition, the number of local connections between pyramidal neurons in the primary somatosensory cortex increases after a change in the sensory experience of the whiskers in rodents. [42]
Evidence for macroscale rewiring comes mainly from studies of gray and white matter density, which may indicate new connections or changes in axon density. Direct evidence for this level of rewiring comes from studies in primates that used viral tracing to map the formation of connections. Primates that were trained to use new tools developed new connections between the intraparietal cortex and higher visual areas of the brain. [43] Further viral tracing studies have provided evidence that macroscale rewiring of connections occurs in adult animals during associative learning. [44] However, it is unlikely that long-distance neural connections undergo extensive rewiring in adults. Small changes in an already established neural tract are probably what is observed in macroscale rewiring.
Functional MRI, both at rest and during task performance, is used to study the functions of connectome circuits. [45] Just as detailed road maps of the Earth's surface tell us little about the types of vehicles that travel along those roads or what cargo they carry, to understand how neural structures give rise to specific functional behavior, such as consciousness , it is necessary to build theories that relate functions to anatomical connectivity. [46] However, the relationship between structural and functional connectivity is not straightforward. Computational models of whole-brain network dynamics are valuable tools for investigating the role of the anatomical network in shaping functional connectivity. [47] [48] In particular, computational models can be used to predict the dynamic effect of lesions in the connectome. [49] [50]
The connectome can be studied as a network using network science and graph theory. In the case of a microscale connectome, the nodes of this network (or graph ) are neurons, and the edges correspond to the synapses between these neurons. For a macroscale connectome, the nodes correspond to regions of interest ( ROIs ), while the edges of the graph derive from the axons connecting these regions. Thus, connectomes are sometimes called brain graphs , since they are indeed graphs in the mathematical sense that describe the connections in the brain (or, more broadly, in the entire nervous system).
One group of researchers (Iturria-Medina et al., 2008) [51] constructed connectome datasets using diffusion tensor imaging (DTI) [52] [53], followed by inferring the average connection probabilities between 70–90 cortical and basal gray matter regions of the brain. All the networks were found to have small-world attributes and a "broad-scale" degree distribution. Analysis of betweenness centrality in these networks demonstrated high centrality for the precuneus , the insula , and the superior parietal and superior frontal cortex . Another group (Gong et al., 2008) [54] applied DTI to map a network of anatomical connections between 78 cortical regions. This study also identified several hub regions of the human brain, including the precuneus and the superior frontal gyrus .
Hagmann et al. (2007) [55] constructed a connection matrix based on fiber densities measured between homogeneously distributed and equal-sized regions of interest, numbering between 500 and 4000. Quantitative analysis of the connection matrices obtained for approximately 1000 regions of interest and approximately 50,000 fiber pathways from two subjects demonstrated an exponential (one-scale) degree distribution, as well as robust small-world attributes for the network. The datasets were obtained from diffusion spectrum imaging (DSI) (Wedeen, 2005) [56], a variant of diffusion-weighted imaging [57] [58] that is sensitive to intravoxel heterogeneities in diffusion directions caused by crossing fiber tracts and thus allows more accurate mapping of axonal trajectories than other diffusion imaging approaches (Wedeen, 2008). [59] The combination of whole-head DSI datasets acquired and processed according to the approach developed by Hagmann et al. (2007) [55] with graph analysis tools originally conceived for animal tracing studies (Sporns, 2006; Sporns, 2007) [60] [61] allows a detailed study of the network structure of human cortical connections (Hagmann et al., 2008). [62] The human brain network was characterized using a wide set of network analysis methods, including k-core decomposition, modularity analysis, node classification, and centrality . Hagmann et al. presented evidence for a structural core of strongly and mutually interconnected brain regions, located mainly in the posterior medial and parietal cortex. The core contains portions of the posterior cingulate cortex , the precuneus , the cuneus , the paracentral lobule , the isthmus of the cingulate cortex , the banks of the superior temporal sulcus , and the inferior and superior parietal cortex, all of which are located in both cerebral hemispheres .
The subfield of connectomics deals with comparing the brain graphs of multiple subjects. One can construct a consensus graph, such as the Budapest Reference Connectome , by allowing only those edges that are present in at least{\ displaystyle k} connectomes, for a selectable {\ displaystyle k}parameter. The Budapest Reference Connectome led researchers to the discovery of the Consensus Connectome Dynamics of the human brain graphs. The edges appearing in all brain graphs form a connected subgraph around the brainstem . By gradually lowering the edge frequency threshold, this core subgraph grows continuously, like a shrub . The dynamics of the growth may reflect the individual development of the brain and offer a way to guide some facets of the consensus human brain graph. [63]
On the other hand, local differences that are statistically significant between groups have attracted more attention, since they highlight specific connections and therefore shed more light on specific brain traits or pathology. Consequently, algorithms have also been introduced for finding local differences between populations of graphs (for example, for comparing cases with control groups). [64] These can be found using either an adjusted t-test , [65] or a sparsity model, [64] with the aim of finding statistically significant connections that differ among these groups.
Possible causes of differences between individual connectomes have also been investigated. Indeed, it was found that the macroscale connectomes of women contain significantly more edges than those of men, and that most of the edges in women's connectomes run between the two hemispheres. [66] [67] [68] In addition, connectomes generally exhibit a small-world pattern , with overall cortical connectivity decreasing with age. [69] The aim of the Lifespan Connectome pilot project, ongoing since 2015, is to identify connectome differences between 6 age groups (4–6, 8–9, 14–15, 25–35, 45–55, 65–75).
More recently, connectograms have come to be used to visualize whole-brain data by placing cortical regions around a circle, organized by lobes. [70] [71] The inner circles then display cortical metrics on a color scale. White matter fiber connections in DTI data are then drawn between these cortical regions and weighted by fractional anisotropy and connection strength. Such plots have even been used to analyze the damage suffered by the famous traumatic brain injury patient Phineas Gage . [72]
Statistical graph theory is an emerging discipline that is developing sophisticated pattern recognition and inference tools for analyzing these brain graphs (Goldenberg et al., 2009).
Eyewire is an online game developed by the American scientist Sebastian Seung of Princeton University . It uses social computing to map the brain's connectome. It has attracted more than 130,000 players from more than 100 countries.

Comments