
Lecture 9 min.
A connectogram is a graphical representation of connectomics , the field of knowledge concerned with mapping all the white matter connections in the human brain. It is usually a circular graph obtained by applying graph theory to diffusion MRI to demonstrate white matter connections.
Connectograms are graphical representations of connectomics , a field of research devoted to mapping and interpreting all the fiber connections of white matter in the human brain. These circular graphs, based on diffusion MRI data, use graph theory to demonstrate white matter connections and cortical characteristics for individual structures, individual subjects, or populations.
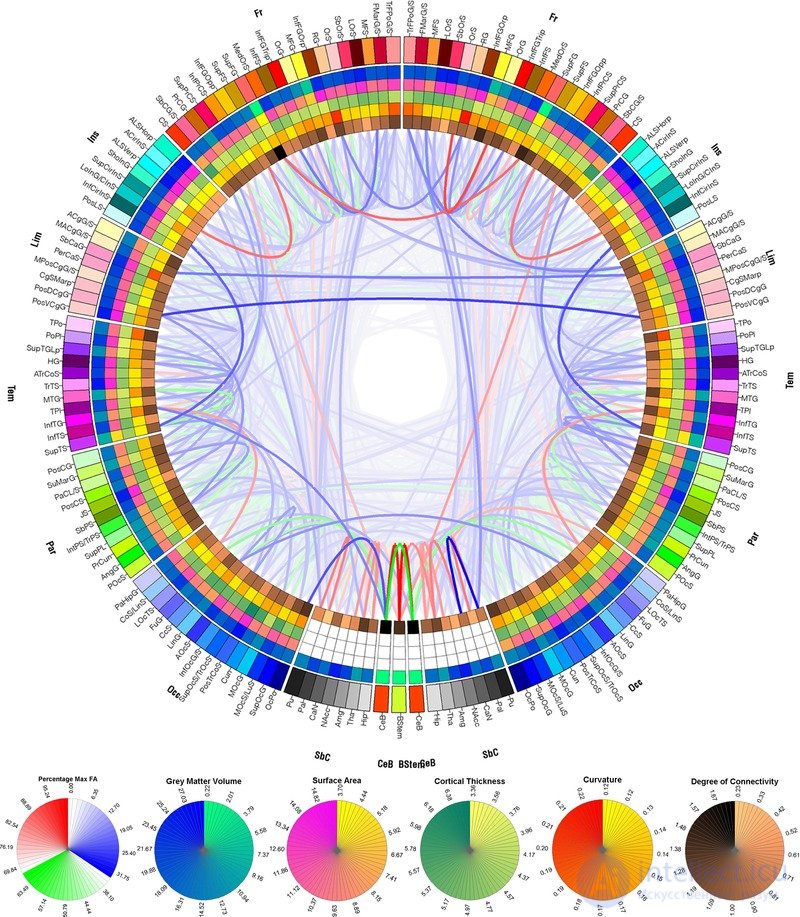
A connectogram showing the averaged connections and cortical properties of 110 healthy, right-handed men aged 25 to 36 years
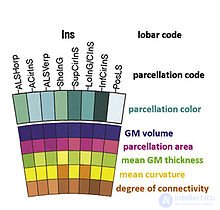
The connectogram as a graphical representation of brain connectomics was first proposed in 2012 . A connectogram is usually a circular graph in which the left half shows the connections of the left hemisphere and the right half those of the right. In turn, the halves are divided into the frontal lobe , the insular lobe, the limbic lobe, the temporal lobe, subcortical structures, and the cerebellum. At the very bottom, between the two hemispheres, the brainstem is also shown. Within these lobes, each cortical region is labeled with its own abbreviation and assigned its own color. The colors are used to find regions in other images of brain surfaces and to assess their relative positions. Inside the ring of cortical regions, nested rings describe such quantities as the gray matter volume of the region, the area of the region, the cortical thickness of the region, the surface curvature of the region, and the degree of connectivity of the region (the relative proportion of the connections of this region to the connections of the whole brain), in order of nesting.
The Connectogram , as a graphical representation of brain connectomics , was proposed in 2012
Circular representations of connections have been used in a number of disciplines; examples include representations of aspects of epidemics, geographic networks, musical rhythms, diversity of bird populations, and genomic data. Connectograms have also been mentioned as a source of inspiration for the style of Tony Stark's helmet heads-up display in " Iron Man 3" .
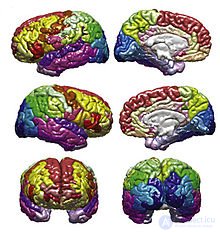
Connectograms are circular, with the left half depicting the left hemisphere and the right half depicting the right hemisphere. The hemispheres are further subdivided into the frontal lobe , the insular cortex , the limbic lobe , the temporal lobe , the parietal lobe , the occipital lobe , subcortical structures, and the cerebellum.. At the bottom, between the two hemispheres, the brainstem is also depicted. Within these lobes, each cortical region is labeled with an abbreviation and assigned its own color, which can be used to denote the same cortical regions in other figures, such as the parcellated brain surfaces in the adjacent image, so that the reader can find the corresponding regions of the cerebral cortex on a geometrically accurate surface, and see how different the connected regions can be. Inside the ring of the cortical surface, concentric circles represent different attributes of the corresponding cortical regions. These metric rings, in order from the outermost to the innermost, represent gray matter volume , surface area., cortical thickness, curvature, and degree of connectivity (the relative share of fibers beginning or ending in a given region, compared with the whole brain). Inside these circles, lines connect regions that were found to be structurally connected. The relative density (number of fibers) of these connections is reflected in the opacity of the lines, so that different connections and their structural significance can be easily compared. The fractional anisotropy of each connection is reflected in its color.
Given the recent concerted effort to map the entire human brain and its connections , it is becoming increasingly important to find ways to graphically represent the large amounts of data involved in connectomics . Most other representations of the connectome use 3 dimensions and therefore require an interactive graphical user interface. A connectogram can display 83 cortical regions in each hemisphere and visually show which regions are structurally connected, all on a flat surface. It is therefore convenient to store in patient charts or to display in print. The graphs were originally created using a visualization tool called Circos ,. [10] [11]
At the individual level, connectograms can be used to inform the treatment of patients with neuroanatomical abnormalities. Connectograms have been used to monitor the progress of neurological recovery in patients who have suffered traumatic brain injury (TBI). [12] They have also been applied to the famous patient Phineas Gage to assess the damage to his neural network (as well as damage at the cortical level, which was the main focus of earlier studies of Gage). [13]
Connectograms can represent average cortical measures (gray matter volume, surface area, cortical thickness, curvature, and degree of connectivity), as well as tractography data such as the average density and fractional anisotropy of connections, in populations of any size. . This allows visual and statistical comparison between groups, such as men and women [14], cohorts of different ages, or healthy control individuals and patients. Some versions have been used to analyze how networks are divided in patient populations [15], or to analyze the relative balance between inter- and intrahemispheric connections. [16]
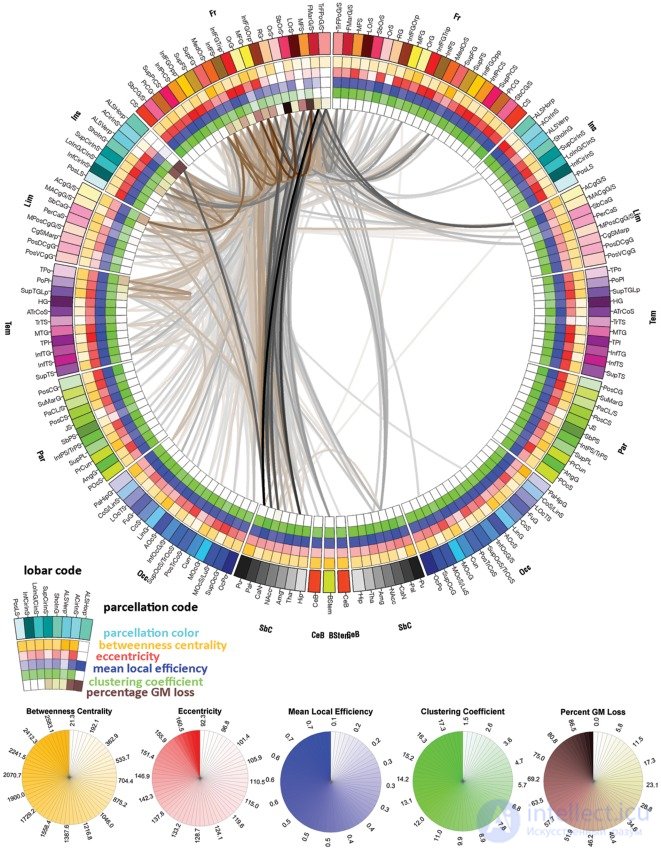
There are many possibilities for which measures are included in the rings of the connectogram. Irimia and Van Horn (2012) published connectograms that explore correlational relationships between regions and use figures to compare graph theory and connectomics approaches. [17] Some have been published without the inner cortical metrics. [18] Others include additional measures related to neural networks , [19] which can be added as extra rings toward the inside to show graph theory metrics, as in the extended connectogram here:
| Acronym | Region in the connectogram |
|---|---|
| ACgG / S | Anterior part of the cingulate gyrus and sulcus |
| ACIRINS | Anterior segment of the circular sulcus of the insula |
| ALSHorp | Horizontal ramus of the anterior segment of the lateral sulcus (or fissure) |
| ALSVerp | Vertical ramus of the anterior segment of the lateral sulcus (or fissure) |
| AngG | Angular gyrus |
| AOcS | Anterior occipital sulcus and preoccipital notch (temporo-occipital incisure) |
| ATrCoS | Anterior transverse collateral sulcus |
| CcS | Calcarine sulcus |
| CgSMarp | Marginal ramus (or part) of the cingulate sulcus |
| CoS / LinS | Medial occipito-temporal sulcus (collateral sulcus) and lingual sulcus |
| CS | Central sulcus (fissure of Rolando) |
| Cun | Cuneus |
| FMarG / S | Fronto-marginal gyrus (of Wernicke) and sulcus |
| FuG | Lateral occipito-temporal gyrus ( fusiform gyrus ) |
| HG | Heschl's gyrus (anterior transverse temporal gyrus) |
| InfCirInS | Inferior segment of the circular sulcus of the insula |
| InfFGOpp | Opercular part of the inferior frontal gyrus |
| InfFGOrp | Orbital part of the inferior frontal gyrus |
| InfFGTrip | Triangular part of the inferior frontal gyrus |
| InfFS | Inferior frontal sulcus |
| InfOcG / S | Inferior occipital gyrus and sulcus |
| InfPrCS | Inferior part of the precentral sulcus |
| IntPS / TrPS | Intraparietal sulcus (interparietal sulcus) and transverse parietal sulci |
| InfTG | Inferior temporal gyrus |
| InfTS | Inferior temporal sulcus |
| JS | Sulcus intermedius primus (of Jensen) |
| LinG | Lingual gyrus, lingual part of the medial occipito-temporal gyrus |
| LOcTS | Lateral occipito-temporal sulcus |
| LoInG/CInS | Long insular gyrus and central insular sulcus |
| LOrS | Lateral orbital sulcus |
| MACgG / S | Middle-anterior part of the cingulate gyrus and sulcus |
| MedOrS | Medial orbital sulcus (olfactory sulcus) |
| MFG | Middle frontal gyrus |
| MFS | Middle frontal sulcus |
| MOcG | Middle occipital gyrus, lateral occipital gyrus |
| MOcS / LuS | Middle occipital sulcus and lunate sulcus |
| MPosCgG / S | Middle-posterior part of the cingulate gyrus and sulcus |
| MTG | Middle temporal gyrus |
| OcPo | Occipital pole |
| OrG | Orbital gyri |
| OrS | Orbital sulci (H-shaped sulci) |
| PaCL / S | Paracentral lobule and sulcus |
| PaHipG | Parahippocampal gyrus , parahippocampal part of the medial occipito-temporal gyrus |
| PerCaS | Pericallosal sulcus (S of the corpus callosum) |
| POcS | Parieto-occipital sulcus (or fissure) |
| PoPl | Polar plane of the superior temporal gyrus |
| PosCG | Postcentral gyrus |
| PosCS | Postcentral sulcus |
| PosDCgG | Posterior-dorsal part of the cingulate gyrus |
| PosLS | Posterior ramus (or segment) of the lateral sulcus (or fissure) |
| PosTrCoS | Posterior transverse collateral sulcus |
| PosVCgG | Posterior-ventral part of the cingulate gyrus (isthmus of the cingulate gyrus) |
| PrCG | Precentral gyrus |
| PrCun | Precuneus |
| RG | Straight gyrus (gyrus rectus) |
| SbCaG | Subcallosal area , subcallosal gyrus |
| SbCG / S | Subcentral gyrus (central operculum) and sulci |
| SbOrS | Suborbital sulcus (rostral sulcus, supraorbital sulcus) |
| SbPS | Subparietal sulcus |
| ShoInG | Short insular gyri |
| SuMarG | Supramarginal gyrus |
| SupCirInS | Superior segment of the circular sulcus of the insula |
| SupFG | Superior frontal gyrus |
| SupFS | Superior frontal sulcus |
| SupOcG | Superior occipital gyrus |
| SupPrCS | Superior part of the precentral sulcus |
| SupOcS/TrOcS | Superior occipital sulcus and transverse occipital sulcus |
| SupPL | Superior parietal lobule |
| SupTGLp | Lateral aspect of the superior temporal gyrus |
| SupTS | Superior temporal sulcus |
| TPl | Temporal plane of the superior temporal gyrus |
| TPo | Temporal pole |
| TrFPoG / S | Transverse frontopolar gyri and sulci |
| TrTS | Transverse temporal sulcus |
| Amg | Amygdala |
| CaN | Caudate nucleus |
| Hip | Hippocampus |
| NAcc | Nucleus accumbens |
| Pal | Pallidum |
| Pu | Putamen |
| Tha | Thalamus |
| CeB | Cerebellum |
| BStem | Brainstem |

Comments