
Lecture 24 min.
Liveness detection for face recognition in biometrics is the ability of a computer system to determine whether the person in front of the camera is alive.
It determines whether the person in front of the camera is who he or she claims to be, whether that person is acting of their own free will, or whether someone else is attempting fraud by showing an image or video of that person, or even by using a fake face mask.
Liveness detection methods can be divided into:
Biometric face liveness detection refers to the use of computer vision technology to detect the harmless presence of a live user, as opposed to an image, a fake video or a mask.
Presentation Attack Detection (PAD) technologies can use both active and passive live face detection methods. Although it is often associated with face recognition , it can also be applied to voice recognition, to distinguish people standing in front of a scanner from speakers playing back recorded audio, or in any scanning situation.
It can also identify and detect fingerprint and palm print biometric data, for example by detecting basic vital signs and blood flow, and even face spoofing with liveness detection using pupil tracking and iris recognition, which is one of the most effective biometric detection methods for detecting and preventing digital data theft and fraud, like our SmileID solution.
The liveness detection function for face recognition in biometrics uses the unique biological identifiers of each person to verify their identity with maximum accuracy and minimal error.
This authentication is based on each person's biometric heritage and is the best achievement in authentication, which consists of possessing unique and irreplaceable data from each person.
This information is, of course, very difficult to change, and research is currently under way on building systems for face liveness detection , which can detect face spoofing without errors or mistakes.
For all these reasons, biometric authentication is susceptible to spoofing threats that try to disrupt the genuine biometric authentication process through liveness detection for face recognition .
Such attacks are uncommon, and efforts are being made to prevent them at any cost with face depth detection solutions . These system failures can be associated with various forms of biometrics. For example, fingerprints, human face recognition, iris analysis, voice, or a person's heartbeat and rhythm. Although biometric systems were once not so reliable, thanks to AI it has become possible to develop fully secure systems.
First, there are several sensing solutions for live face detection methods to prevent biometric spoofing threats, ranging from "active" anti-spoofing methods to "passive" anti-spoofing methods.
The most popular solutions for general sensing for face liveness detection and for use in commercial applications are those that require only computer vision. These methods, which use depth sensors, can be applied to simple video streaming performed by a client using only a phone camera.
For power plants, border access control and other high-security facilities, advanced live face detection methods, and even combinations of them, are used.
Active anti-spoofing methods of face liveness recognition require the user to perform some movement in front of the camera, such as blinking or moving a part of their body, for example face recognition anti-spoofing with liveness detection using pupil tracking, which we have seen in films.
Among the active anti-spoofing methods of liveness for face recognition, eye blinking and smile detection are the most commonly used, for example SmileID with electronic identification , used for authentication with face liveness detection and recognition .
SmileID verifies identity remotely in a few seconds, checking that the person is alive by making them smile, with the support of the AML5 and eIDAS rules for the use of this technology.
Passive anti-spoofing methods, such as face recognition anti-spoofing with liveness detection using pupil tracking, require a comprehensive study of facial movements, facial expressions and sequence commands for liveness detection for face recognition in video, which can also determine the depth of the face.
However, the fact is that these methods are prone to false rejections and are capable of fooling face liveness detection systems, so it is important to use accurate and secure systems such as SmileID .
• Examining the reflectance spectrum of the eye. The reflectance spectrum of a live, moist
cornea differs from that of a dead, dried-out one, or of a glass or plastic model. However, this protection method can be bypassed by moistening
a dead eye or by coating the model with a layer of moist protein emulsion (a gelatin solution).
• Examination of hippus/nystagmus. Involuntary movements of the pupil and the eye are good evidence of its liveness, but there are people in whom these
movements are very weak or occur rarely (once every few
minutes).
• Flashing randomly chosen LEDs of the illuminator at randomly chosen moments in time and checking the reflection of the illuminator in the corresponding frames of the video sequence.
• Examination of the pupil's response to a light stimulus (delivered at a random moment in time).
The last method is the most interesting because, besides establishing the authenticity and liveness of the presented eye, it makes it possible to obtain a record of the response of the
pupil, a pupillogram. From the pupillogram one can determine a person's condition, activity, level of exhaustion and stress level. This additional
data may be needed in systems installed at the checkpoints of important industrial and military facilities, whose employees may be
admitted to work only in good physical and mental condition. The drawback of this method is that recording a pupillogram requires about
0.5 seconds of continuous filming of the eye to confirm liveness and at least
2 seconds to determine the person's condition.
This hardware method is based on determining the brightness ratios of images and their elements obtained when the eye is illuminated with light of different
wavelengths. The reflectance spectrum of the tissues of a live eye and of possible fakes
differs. The absorption and reflection of visible light and near-IR radiation
by various body tissues and their components (blood, fat, water, melanin
and others) have been studied in many works, for example .Multispectral images obtained under near-infrared
(860 nm) and blue (480 nm) illumination are used. However, this method has two significant drawbacks. First, this protection method can be easily overcome
by moistening a dummy iris with water or by gluing onto it a transparent moist gelatin film whose spectrum in the IR region is identical to that of body tissues. Second, the reflectance spectrum differs significantly
between representatives of different races (Caucasoid, Mongoloid, Negroid). It seems that the interracial variability of the spectrum even exceeds the difference
between a live eye and a fake. In addition, studying the spectrum requires
additional illuminators and sensors, which complicates the equipment and significantly limits the area of application. Overall, this approach is
still poorly developed.
This hardware method is based on the reflection of light from the retina of the eye.
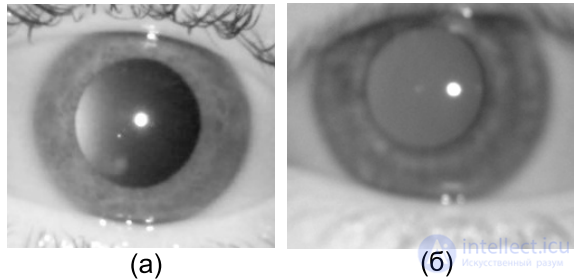
Fig. 4.14 gives examples of the partial and full effect. In [376], as well as in
Fig. 4.14. Examples of the "red-eye" effect, as well as of Purkinje points. (a) — partial one-sided effect; the Purkinje point is visible to the lower left of the glint. (b) — the whole pupil is lighter than the
iris; the Purkinje point is out of focus, visible as a blurred spot to the left of the glint in the center of the
pupil
a number of patents, it is proposed to use so-called active illumination, consisting
of several illuminators switched on alternately, to create the "red-eye" effect, on the basis of which the pupil is detected quite simply
and the liveness of the eye is also checked. However, the effect appears reliably only with a sufficiently large pupil, when the optical path illuminator-retina-camera is not blocked by the iris. With a small pupil size it is difficult to achieve the effect. Overall, this approach is still poorly developed.
Purkinje images are reflections of an illuminator from the anterior and posterior surfaces of the lens; the reflection from the cornea is also counted among them.
The convex anterior surface of the lens gives a relatively weak visible reflection, the concave posterior surface a stronger one. Both of these reflections are significantly
weaker than the reflection from the cornea. Fig. 4.14 gives examples of eyes with one visible Purkinje image. Fig. 4.15 shows an example of both images. Using this method [334] for protection against fakes also assumes the presence of several illuminators switched on alternately, in order to
obtain changes in the geometry of the Purkinje images, which testifies
to authenticity. However, it is also difficult to achieve a stable manifestation of this effect that can be registered and
determined.
The simplest way to fake an eye is to print its digital photograph on a high-resolution printer. If the eye is printed at life size, its image is quite similar to the image of a directly registered "live" eye.
Modern inkjet printers have high resolution; commercially available
printers can deliver a resolution of 2400 dpi. The size of the iris is 12 mm ≈ 0.5 inch, so the printed image has
a linear size of 1200 print dots. A high-quality image should
contain at least 200 pixels [394].
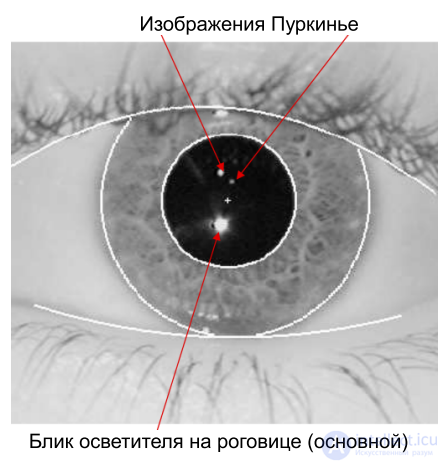
Fig. 4.15. Example of Purkinje images
Thus, one pixel of the registered image can correspond to up to six print dots (linear size), that is, an image pixel is obtained by averaging about
thirty print dots. In this case the brightness variations caused by the discreteness of printing are small and cannot be detected. However, the toner used in modern inkjet printers is practically invisible in the near IR,
and an image printed on such a printer cannot be captured, since it has
low quality. Therefore, the inkjet printers that are common now
cannot be used to fake an iris.
The toner of laser printers is visible in the IR range, and images produced with them are perceived by iris recognition registration systems. A problem of
modern laser printing technology is the sticking together of toner grains. To
eliminate random sticking, image graining is used. An example of an
image obtained from a real eye and one obtained by registering a printed image of the same eye is given in Fig. 4.16.
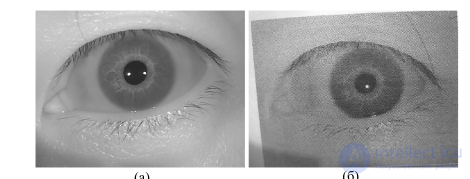
Fig. 4.16. Images of an eye: (a) — obtained by direct registration; (b) — obtained from a printed one
This graininess can be detected by various methods. Three such methods have been developed.
The Fourier coefficients form the space of primary features. Using these features, it is proposed to classify the two types of images
described above. Since the dimensionality of the primary feature space
is large, it is proposed to construct new features that will then be used directly for classification.
To construct the new (secondary) features, the dependence of
spectral energy on frequency is used, also called here the radial component of the Fourier image. First, this approach can reduce the dimensionality
of the classification problem. Second, because the supposed prominent harmonic has approximately equal spatial frequencies,
when moving to the radial component, these harmonics should be superimposed
on one another. As a result, the problem reduces to a classification problem.
Let us consider an image as a grid function f(x, y), where x = 0, 1, . . . M− 1, y = 0, 1, . . . N − 1.
The discrete Fourier transform can be written in the following form

The elements of the matrix 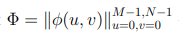 — are the space of primary features. A secondary feature is understood to be some function g(Φ). The task is to choose a sufficiently small set of secondary
features 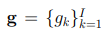 , which would reflect the distribution of the spectrum density Φ (it is assumed here that I is much smaller than MN). In particular, of interest is the presence of maxima in the high-frequency region, which indicates
the presence of high-frequency periodic noise, which is observed in
fake printed images.
For image classification, a metric classifier of the following form is used

where u is the image being classified, X+ and X− are the training samples of genuine and fake images respectively, and the function W(u, X) determines
the membership of object u in class X.
Let the image f(x, y) be transformed according to (4.29) into ϕ(u, v) by means of the fast Fourier transform.
As a first step, let us introduce the notion of the radial component of the Fourier image Φ.
Note that the zeroth harmonic of the spectrum in our representation is ϕ(0, 0)
(low frequencies are usually the most intense). Therefore we take the point (0, 0) as the
pole. Next we group all points (u, v) by Euclidean distance to (0, 0),
taking into account the toroidal wrap-around of the grid. Denote

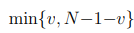
and consider the set

.
Taking into account that the values of r are integers, we can introduce the radial component of the Fourier image as

. From a physical point of view, the function R(r)
shows the energy of the spectrum in a ring of unit thickness with inner radius r.
Now let us describe the procedure for obtaining the secondary features 
. To do this, we introduce the notion of an integral feature for the radial component of the Fourier image.
We call the following quantity the integral feature θ(α), 0 < α < 1, for R(r)

Physically, the integral feature shows the radius of the circle r inside which
a fraction α of the total spectrum energy is contained. The main idea is that
these integral features reflect the distribution of the spectrum density.
Therefore, for the spectra of genuine images, which decrease almost monotonically, and the spectra of fake images, which have distinct high-frequency
peaks, these characteristics should differ significantly.
However, it is not clear a priori which values of α should be chosen. It must also be taken into account that a significant part of the density is concentrated near zero
frequencies.
It is proposed to construct a sequence αk such that the sequence δk = αk−αk−1 decreases sufficiently fast. Let us set δk = 2−k
, α0 = 0
and accordingly 
(generally speaking, one can take δk to be
any infinitely decreasing geometric progression). Owing to the discreteness of the problem, there exists an index I such that θ(αI ) = rmax and the sequence terminates there.194
Then we define gk = θk − θk−1, k = 1, . . . I. Thus,
the secondary features gk are the jumps of the integral features. Namely: when the argument changes from θk by the amount gk, the area under the graph
increases by the fraction δk of the total area. A large value of gk indicates
the presence of a peak in the spectrum.
The choice of infinitely decreasing geometric progressions reflects the implicit assumption that for a real image the energy density of the
spectrum decreases exponentially with radius. In this case the sequence θk will be an arithmetic progression, and the sequence gk constant.
Note that, generally speaking, I depends on the image under study,
but the sequence θk can be continued in a stationary manner, so it is
sufficient to set a single threshold I* for all images. For example, it
can be chosen as the maximum value of I on the training sample.
Note also that one does not have to recompute the sum ∑θ
r=0 R(r) each time,
but can determine θk = θ(αk) as follows

As the metric on the sets g, the Euclidean metric in RI is chosen
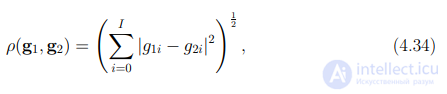
For classification, the Parzen window method with an exponential kernel is used 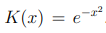
. The window width h is chosen equal to the maximum
distance between the object u being classified and an element of the training sample
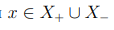

where ρˆ(u, x) = ρ(g(u), g(x)) is defined by (4.34). From this we obtain the following
membership function of object u in class X

and the classifier takes the following form

Let us show that the running time of both the classifier and the training algorithm is determined by the running time of the spectral transform.
The complexity of the fast Fourier transform is O(L log L), where L = NM is the number of pixels in the image. The complexity of the rest of the algorithm
is linear in L. Indeed, the computation of the radial component
according to formula (4.31) is performed in at most 3MN arithmetic
operations (taking into account the partition of all points into classes S(r)). The construction of each
integral feature θk, together with gk, takes at most 2rmax =√M2 + N2
arithmetic operations (the radial component R(r) = 0 for r > rmax).
Here the number of features I is fixed and small compared with L. The complexity of the classification itself is determined only by the size of the training sample l and the number of features I (l is also much smaller than L). Thus, the overall complexity of the algorithm can be estimated as O(Llog L).
In the computational experiment, images with a resolution of 640×480 were used, that is, in formula (4.29) one should set N = 640, M = 480.
The images were divided into 4 groups: two groups were used as the
training sample, the other two as the test sample. In the training sample, 1000 real and 1000 fake images were used; in
the two test samples there were 3000 images each. Classification was also carried out on smaller sample sizes (on the order of 100
images). As expected, the presence of periodic noise leads to a strong difference between the spectra obtained after the discrete Fourier transform according to
formula (4.29). Fig. 4.17 shows the result of the Fourier transform for the eye images in Fig. 4.16.
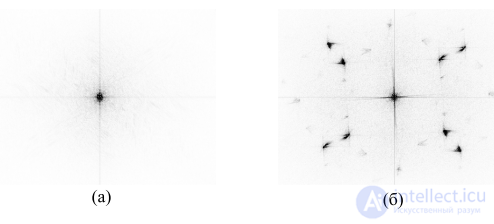
Fig. 4.17. Two-dimensional Fourier image of an image
As can be seen from the last figure, the spectrum of the printed image has 8 side maxima; moreover, there are two groups of 4 maxima located at approximately the same distance from zero frequency. When constructing the radial component of the Fourier image by formula (4.31), two
peaks are obtained for the spectrum of the printed image. For the spectra given above, the radial components are shown on a logarithmic scale in Fig. 4.18.
As the experiment showed, it is sufficient to choose a very small number of features to reveal the differences.
First, for almost all images the value of I (the index of the integral feature after which the sequence θk stabilizes) did not exceed 10. Second, significant differences
in the secondary features gk arise already for k < 5. Therefore, in the experiment
I = 10 was assumed.
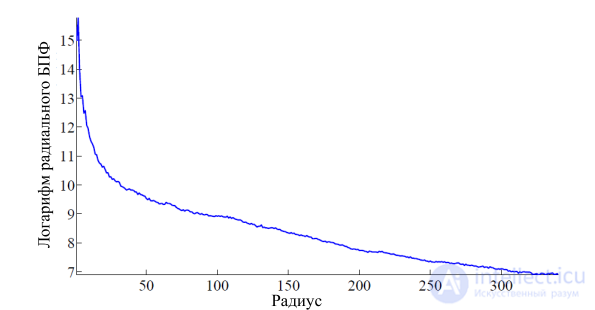
Fig. 4.18. Radial component of the Fourier image of (a) a real and (b) a fake image
For the two images considered above, the graphs of the values of gk are given in Fig. 4.19 and Fig. 4.20.
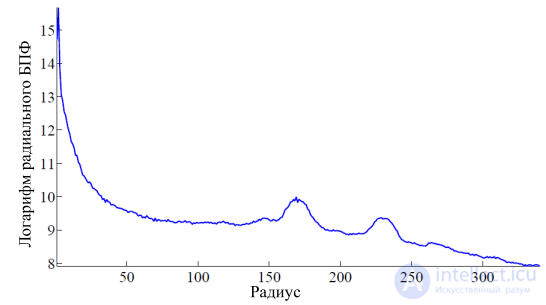
Fig. 4.19. Values of the features gk for the images in Fig. 4.16
In the case of the printed image, a sharp peak is visible at k = 3, which indicates a side maximum in the spectrum. The graph of the values of gk for a test
training sample of 20 images is shown in Fig. 4.21. Each polyline
corresponds to the set of features of one image. Judging by Fig. 4.19 and 4.20,
it can also be noted that the assumption of an exponential form of R(r) is not satisfied. As a consequence, the sequence gk is not constant.
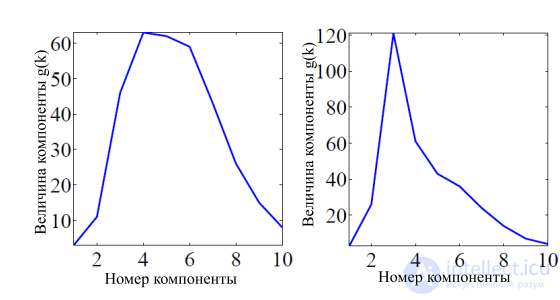
Fig. 4.20. Values of the features gk for the images in Fig. 4.16
However, formally this has no effect on the further analysis.
The equal error rate of liveness detection by this method is 8%.
The main cause of errors in the classifier's operation was
the lack of focus in a significant number of images. This is
because the images were obtained in series (camera shooting), of which only one or two images are in focus. On well-
focused photographs and with a large training sample (more than 100
images) the error rate did not exceed 4 − 6% (this applies to misclassifications of both fake and genuine images). In general,
with a training set of more than 100 images that includes
poorly focused images, the error rate did not exceed 10 − 15%.
However, on small samples (fewer than 50 images) the rate of second-type errors
(a fake image recognized as genuine) reached 25 − 30%.
Possible solutions to this problem are preliminary filtering of the images and processing images of a single eye in series. In
the latter case, a series is classified as printed if at least one
of the images in the series is classified as printed.
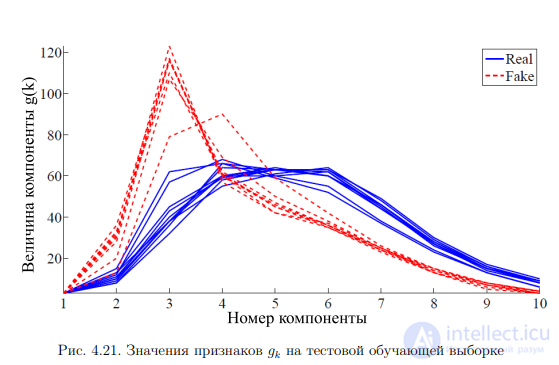
Fig. 4.21. Values of the features gk on the test training set
Gradient histogram
A simpler, faster and more accurate method is the analysis of the histogram
of brightness gradients. The gradients are computed with the Sobel operator. The distribution of the gradient magnitude differs for real and fake images.
Fake images contain a large number of edges (pixels with a high brightness gradient) because of the print screen. Therefore the histogram
of a fake image is shifted toward high values. Fig. 4.22
shows typical brightness histograms of a real and a fake image. The optimal estimate of the spread of the gradient histogram was found experimentally to be the 80% quantile. The equal error rate of liveness detection by this method is 0.44%.
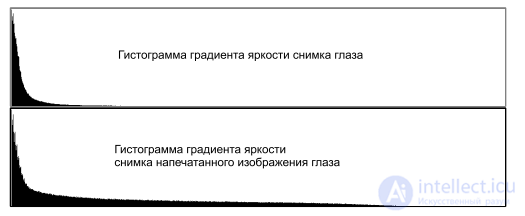
Fig. 4.22. Histograms of the brightness gradient magnitude.
Morphological difference
It can be noted that the print screen consists of many separate small dark regions within light areas and many small dark
dots within dark areas. Therefore the morphological opening and closing operations change fake images quite strongly. At the same time,
real images that contain only large regions change little
under these transformations. The difference between the results of closing (a superposition of dilation and erosion) and opening (a superposition of
erosion and dilation) will be large for fake images and small for real ones:

where B is the structuring element of the morphological operation.
Fig. 4.23 shows the histogram of the image |Delta in a typical case. The equal error rate of
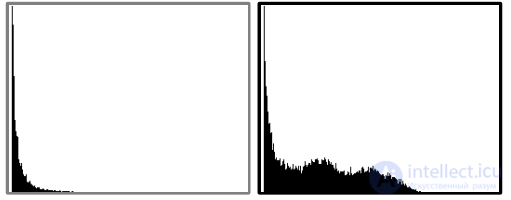
Fig. 4.23. Histograms of the brightness difference after the opening and closing operations.
liveness detection by this method is 0.15%.
An obvious sign of a living eye is its movement. The known
natural movements of the eye are hippus (aperiodic changes in
pupil radius), nystagmus (involuntary oscillatory eye movements), saccades (coordinated eye movements needed to look at an object of
attention), and blinking. The use of hippus, nystagmus and blinking to determine eye liveness was proposed in [459] and in a number of patents. However, hippus and nystagmus are involuntary and aperiodic movements, and moreover,
in some people they are absent or occur rarely. Saccades can be induced by presenting a moving stimulus or one with a complex
structure, which is a rather difficult technical
problem. A person can blink on request of the system, but reliably detecting a blink and distinguishing the blink of a living eye from that of a mock-up is a difficult and ambiguous task. For this reason, these methods, proposed
quite long ago, have not been developed further.
A characteristic eye movement is the reaction of the pupil to an external stimulus. As a rule, when there is a sharp external stimulus (a flash of light, a sudden sound, pain), the pupil contracts quickly; the contraction phase takes
less than one second, after which a relatively slow recovery to the initial size follows. The features of this reaction depend on the state of
the person at the moment of measurement, and there are also individual differences between people. The study of the relationship between the features of the reaction and the functional state of a person belongs to the field of medicine called pupillography
[38, 175]. Fig. 4.24 shows a typical pupillogram, a graph of pupil radius versus time. The pupillogram has a characteristic shape,
and because of individual differences it can serve as an additional modality for identification.
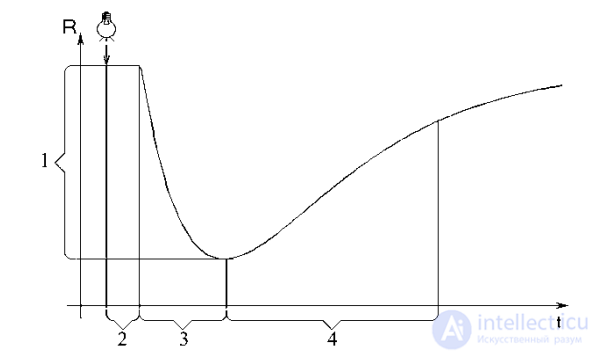
Fig. 4.24. Shape of a pupillogram. The numbers denote: 1 – amplitude; 2 – latency; 3 – contraction phase; 4 – recovery phase.

Comments